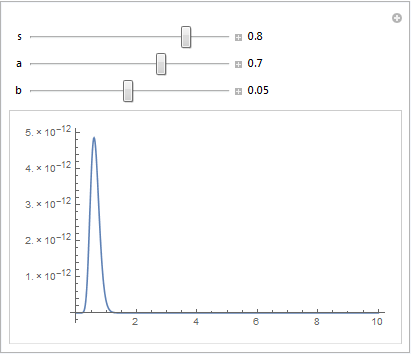
I'm having a problem with DynamicModule; the code below produces a plot with a line that changes value, based on the slider positions of the parameters, which is very nearly what I want; I would simply like that line to have slightly more bends, and to alter those bends properly, in accordance with the formula it is ostensibly drawing from.
I've read through the dynamic introduction, the DynamicModule page and the advanced functionality documentation, and while I have an idea as to the issue, I'm not at all convinced it is the sole culprit, nor do I have ideas as to the solution
I suspect that by making r the argument of module (as it must be, to avoid global contamination), I am preventing the function from evaluating it properly, leading to the titular problem. Another theory is that I have somewhere changed the Head of something in a way that is leading to MMA refusing to evaluate the function, or done something invalid scoping-wise, in which case I may be stuck. I have not found anything that would recommend a solution thus far.
Slider[Dynamic[a]] "a = " Dynamic[a]
Slider[Dynamic[b]] "b = " Dynamic[b]
Slider[Dynamic[s]] "\!\(\*SubscriptBox[\(N\), \(0\)]\) = " Dynamic[s]


DynamicModule[ {r},

\[Eta][r_] = s (r^((1 - 3 b)/b) E^(-r/(a  b)));


Dynamic[Plot[\[Eta][r], {r, 0, 10}]]]
What I do not currently understand is why this is not producing a graph of the shape r^-number E^(-r/number) that shifts slightly when the sliders for the constants are altered, as is my goal (this is a size distribution, and I'd like to provide readers of the notebook an idea of what the size distro looks like while simultaneously using that distribution in the calculation of important data).
Thus far, I have tried: recasting the dynamic plot into a manipulate, switching the ordering of dynamic and plot, placing the sliders inside the dynamic module, breaking the module and removing r as a dynamic variable (something not feasible for the long term, considering the necessity of manipulating other functions).
Furthermore, this snippet (with the aid of the aforewritten sliders, which work just fine) produces the result I'm looking for, shape wise and behavior wise, but obviously uses a global variable as opposed to a module one.
TestFunction[p_] := s p^((1 - 3 b)/b) E^(-p/a b)
Dynamic[Plot[testFunction[p], {p, 0, 100}]]
However wrapping this in DynamicModule with first argument p produces 'Null', reinforcing my theory that the nature of dynamic module is preventing the function from being evaluated; however I don't see how a local variable would affect the function as written, especially as it is defined within the module itself. Furthermore if this is the case, I'm not sure how to resolve the issue of keeping one local value for a function so that it can be graphed while simultaneously having other functions (Which rely on r being a variable, due to them integrating over it; MMA very much dislikes the dr part of an integral if r has a numerical value) use it.
I am all but sure that I am missing something painfully obvious as to how to create a module to do the same thing, but thus far, searches (through stackexchange and the almighty google) and testing have been fruitless.
I do hope I have been sufficiently specific, as this is my first stack-exchange query after much lurking; if there is any vital information I have neglected to provide, please let me know.


