MWE
I have some data indexed by gamma. For each gamma I want to find the intersection points of two lists and plot the lists and the intersection points. I convert the two lists into two functions ifun[gamma] and ifun2[gamma] using interpolation, find their intersection using FindRoot and plot them. Instead of creating a separate plot for each gamma, I'd like to be able to throw that inside Manipulate. But I am running into trouble with Manipulate needing to explicitly define dependence on variables, as mentioned in the possible issues.
Table[ifun[gamma]=Interpolation[Table[{i, i^gamma}, {i, 1, 10}]], {gamma, 1, 2, 1}]
Table[ifun2[gamma]=Interpolation[Table[{i, gamma^gamma}, {i, 1, 10}]], {gamma, 1, 2, 1}]
Table[solE[gamma] = {x} /.FindRoot[ifun[gamma][x] == ifun2[gamma][x], {x, 0.15}], {gamma, 1,  2}]

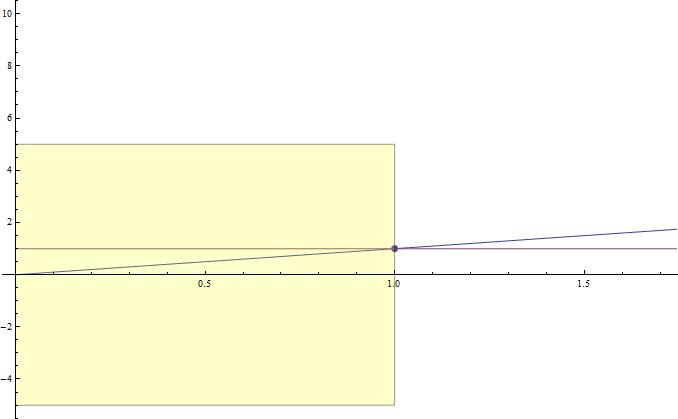
Framed@Show[ListPlot[{#, ifun[1][#]} & /@ solE[1], PlotStyle -> PointSize[Large]], Plot[{ifun[1][x], ifun2[1][x]}, {x, 0, 10}],RegionPlot[x < solE[1][[1]] && -5 < y < 5, {x, 0, 10}, {y, -5, 5}, PlotStyle -> {{Yellow, Opacity[0.2]}}]]

Update2
Ok so I did the indexing on the data and not on the functions, solved for the solutions outside the manipulate and just stored the points, interpolated inside Manipulate for plotting..and it works.
Table[data1[gamma] = Table[{i, i^gamma}, {i, 1, 10}], {gamma, 1, 2}]
Table[data2[gamma] = Table[{i, gamma^gamma}, {i, 1, 10}], {gamma, 1, 2, 1}]
Table[solE[gamma] = {x} /.FindRoot[Interpolation[data1[gamma]][x] ==
 Interpolation[data2[gamma]][x], {x, 0.15}], {gamma, 1, 2}]
This works:
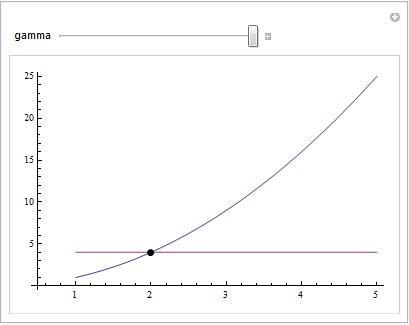
Manipulate[fun = Interpolation[data1[gamma]];fun2 = Interpolation[data2[gamma]];Plot[{fun[x], fun2[x]}, {x, 1, 5}, Epilog -> {Black, PointSize[Large], Point[{solE[gamma][[1]], fun[solE[gamma][[1]]]}]}, AxesOrigin -> {0.5, 0}], {gamma, 1, 2, 1}]


