0
$\begingroup$

I have written the following code:

fit6peakslorentz[data_, minpos_] := Module[
{pltdta, fit, fitfu, pltfit, fit1, mini, maxi, amp0, begin, end},
pltdta = ListPlot[data, PlotRange -> All];
(* start vals *)
mini = Min[Transpose[data][[2]]];
maxi = Max[Transpose[data][[2]]];
(* x00 = Select[data, #[[2]] \[Equal] mini &][[1]][[1]];*)
amp0 = mini - maxi;
begin = Last[Transpose[data][[1]]];
end = First[Transpose[data][[1]]];
(* now fit *)
fit = NonlinearModelFit[
  data,
  c + q1 (y1^2/((x - x01)^2 + y1^2))
   + q2 (y2^2/((x - x02)^2 + y2^2))
   + q3 (y3^2/((x - x03)^2 + y3^2))
   + q4 (y4^2/((x - x04)^2 + y4^2))
   + q5 (y5^2/((x - x05)^2 + y5^2))
   + q6 (y6^2/((x - x06)^2 + y6^2)),
  {
   {c, maxi},
   {q1, amp0}, {x01, minpos[[1]]}, {y1, 1},
   {q2, amp0}, {x02, minpos[[2]]}, {y2, 1},
   {q3, amp0}, {x03, minpos[[3]]}, {y3, 1},
   {q4, amp0}, {x04, minpos[[4]]}, {y4, 1},
   {q5, amp0}, {x05, minpos[[5]]}, {y5, 1},
   {q6, amp0}, {x06, minpos[[6]]}, {y6, 1}
   },
  x
  ];
fitfu[x_] = c + q1 (y1^2/((x - x01)^2 + y1^2))
 + q2 (y2^2/((x - x02)^2 + y2^2))
 + q3 (y3^2/((x - x03)^2 + y3^2))
 + q4 (y4^2/((x - x04)^2 + y4^2))
 + q5 (y5^2/((x - x05)^2 + y5^2))
 + q6 (y6^2/((x - x06)^2 + y6^2)) /. fit["BestFitParameters"];
pltfit = 
 Plot[fitfu[x], {x, begin, end}, PlotRange -> All, PlotStyle -> Red];
 Print[Show[pltdta, pltfit, PlotRange -> {{begin, end}, All}]];
 fit["ParameterTable"]
 ]

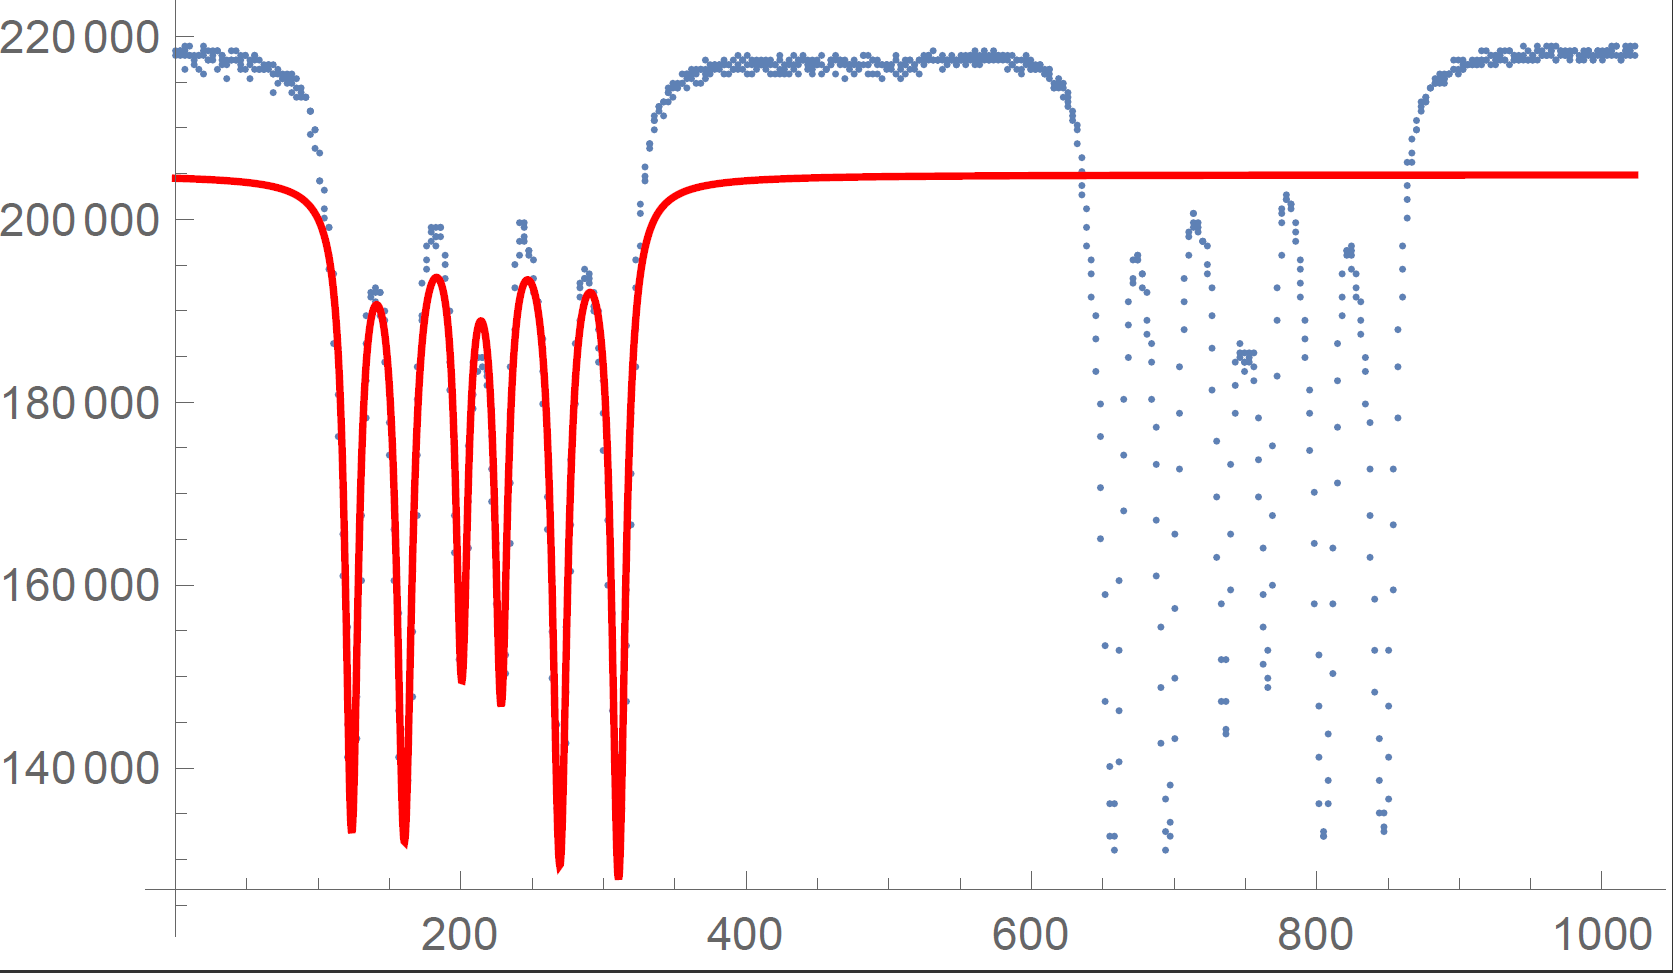
but it fails to fit the way I want it to. Entering the peaks manually the code finds them fine but the offset is all wrong: enter image description here
$\endgroup$
1
  • 3
    $\begingroup$ Can you give us access to your data? Pastebin perhaps? $\endgroup$
    – MarcoB
    Commented Apr 3, 2016 at 21:50

2 Answers 2

2
$\begingroup$

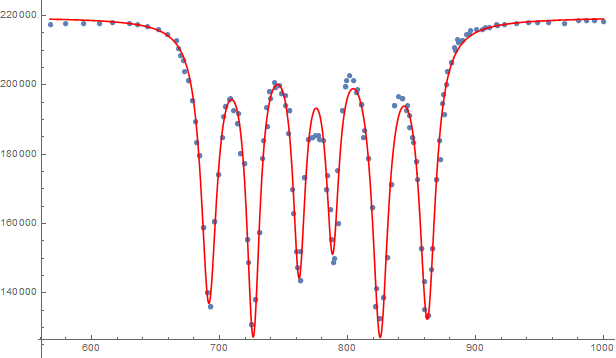
This is an extended comment rather than an answer. I (crudely) digitized the data from about $x=600$ to $x=1000$ and gave initial estimates for what I would call the 6 troughs (rather than peaks) and your code seemed to work fine:

fit6peakslorentz[data, {691, 728, 765, 791, 827, 864}]

curve fit

As @MarcoB suggested, making available the subset of the data you used along with the initial values used would go a along way to determine the problem.

$\endgroup$
1
$\begingroup$

Turns out the program was taking the six peaks on the right side of my graph and averaging them to find the constant I had asked it to look for. I solved this by removing the second half of my data, but I believe it could also be solved by adding more troughs in the equation to account for them. Thanks for the help!

$\endgroup$
1
  • 2
    $\begingroup$ Good. You might consider marking your answer as the accepted answer to bring formal closure to the question. $\endgroup$
    – JimB
    Commented Apr 4, 2016 at 3:05

Your Answer

By clicking “Post Your Answer”, you agree to our terms of service and acknowledge you have read our privacy policy.

Not the answer you're looking for? Browse other questions tagged or ask your own question.