4
$\begingroup$

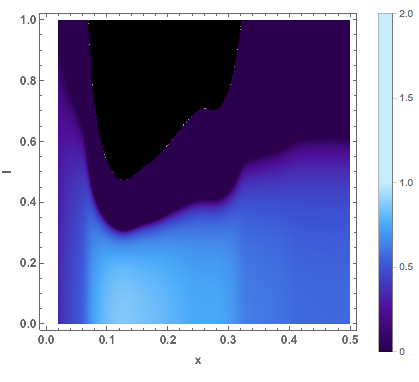
I'm plotting a densityplot map from interpolated data.

I need to draw lines in which the value of my function is constant (isolines), but to be constant is not the function itself but a manipulation: I plot z(x,y)=a(x)-b(x,y) the isoline is b(x,y)=costant

plotter[min_, max_, NumberOfTicks_] := 
 DensityPlot[
  If[S*DOS[x] < 1, 
   If[δ - λ > 0, δ - λ, 0.1], -1], {x, 
   0.02, 0.5}, {S, 0, 1}, PlotPoints -> 100, 
  PlotRange -> {Automatic, Automatic, {2.5, 0}}, 
  ColorFunctionScaling -> False, 
  ColorFunction -> (ColorData["DeepSeaColors"][
      LogarithmicScaling[#, min, max]] &), 
  PlotLegends -> 
   BarLegend[{ColorData["DeepSeaColors"], {0, 2}}, 
    LegendMarkerSize -> 370, 
    Ticks -> ({LogarithmicScaling[#, min, max]} & /@ (min (max/min)^
          Range[0, 2, 1/NumberOfTicks]))], 
  ClippingStyle -> {RGBColor["NightBlue"]}, Frame -> True, 
  BaseStyle -> {FontWeight -> "Bold", FontSize -> 12}, 
  FrameLabel -> {"x", "I"}]
plotter[0.1, 3, 2]

enter image description here

$\endgroup$
5
  • $\begingroup$ Welcome to Mathematica.SE! 1) As you receive help, try to give it too, by answering questions in your area of expertise. 2) Take the tour and check the faqs! 3) When you see good questions and answers, vote them up by clicking the gray triangles, because the credibility of the system is based on the reputation gained by users sharing their knowledge. Also, please remember to accept the answer, if any, that solves your problem, by clicking the checkmark sign! $\endgroup$
    – user9660
    Commented Feb 11, 2016 at 13:55
  • $\begingroup$ Could you please post the definitions of your functions and any other relevant code? $\endgroup$ Commented Feb 11, 2016 at 13:56
  • $\begingroup$ People here generally like users to post Mathematica code instead of descriptions, so they can copy-paste it. It makes it convenient for them and more likely you will get someone to help you. $\endgroup$
    – user9660
    Commented Feb 11, 2016 at 13:56
  • $\begingroup$ @Iris, actually all we really need are the definitions of a[x] and b[x,y], which you've left out. $\endgroup$
    – Jason B.
    Commented Feb 11, 2016 at 14:08
  • $\begingroup$ But in my opinion, the general question of combining a density plot with an isoline is answered below, and doesn't really depend on the actual definitions of the functions involved. $\endgroup$
    – Jason B.
    Commented Feb 11, 2016 at 14:09

1 Answer 1

7
$\begingroup$

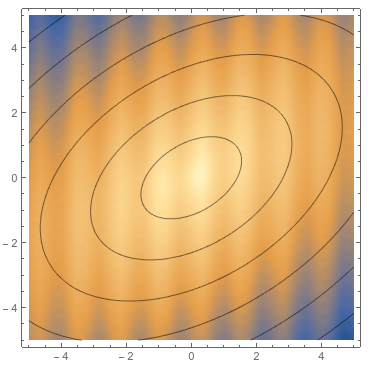
It sounds to me like you want to put a contour plot of b[x,y] on top of a density plot of a[x]-b[x,y], easy enough to do

a[x_] := Sin[5 x]
b[x_, y_] := Sqrt[2 x^2 + 3 y^2 - 2 x y]
Show[
 DensityPlot[a[x] - b[x, y], {x, -5, 5}, {y, -5, 5}],
 ContourPlot[b[x, y], {x, -5, 5}, {y, -5, 5}, 
  ContourShading -> False]
 ]

enter image description here

$\endgroup$
7
  • $\begingroup$ @Iris, great! If you want to include only a single contour line with a given value, use something like ContourPlot[b[x, y] == 4, {x, -5, 5}, {y, -5, 5}, ContourShading -> False] $\endgroup$
    – Jason B.
    Commented Feb 11, 2016 at 14:14
  • $\begingroup$ Great, It works! Thank you I'm new in using mathematica $\endgroup$
    – Iris
    Commented Feb 11, 2016 at 14:15
  • $\begingroup$ @Iris, glad to help. If that solves it, be sure to click the check mark next to the answer so it isn't listed as an unanswered question any longer. $\endgroup$
    – Jason B.
    Commented Feb 11, 2016 at 14:17
  • $\begingroup$ done! I'm new on this site too. I'm really grateful!! $\endgroup$
    – Iris
    Commented Feb 11, 2016 at 14:21
  • 2
    $\begingroup$ great answer, but could be also combined into one plot with: DensityPlot[a[x] - b[x, y], {x, -5, 5}, {y, -5, 5}, MeshFunctions -> (b[#1, #2] &), Mesh -> 5] $\endgroup$
    – chuy
    Commented Feb 11, 2016 at 16:15

Your Answer

By clicking “Post Your Answer”, you agree to our terms of service and acknowledge you have read our privacy policy.

Not the answer you're looking for? Browse other questions tagged or ask your own question.