0
$\begingroup$

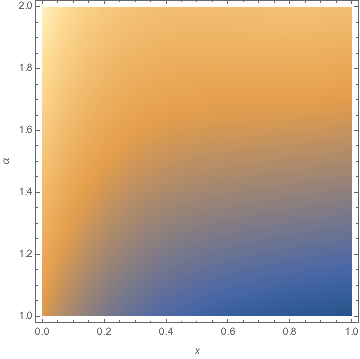
I want to make a DensityPlot showing $y(x)$ plotted against $x$ and $\alpha$, with the following differential equations

α = 1
NDSolve[{α*y'''[x] + 8 y''[x] + 17 y'[x] + 10 y[x] == 0, 
   y[0] == 6*α, y'[0] == -20, y''[0] == 84}, y, {x, 0, 1}];
Plot[Evaluate[y[x] /. %], {x, 0, 1}]

where $\alpha$ is varied between 1 and 2.

$\endgroup$

2 Answers 2

2
$\begingroup$

You want the fantastic function ParametricNDSolve:

Clear[α]

sol = ParametricNDSolve[{
   α y'''[x] + 8 y''[x] + 17 y'[x] + 10 y[x] == 0,
   y[0] == 6 α,
   y'[0] == -20,
   y''[0] == 84}, 
  y, {x, 0, 1}, {α}]

DensityPlot[Evaluate[y[α][x] /. sol], {x, 0, 1}, {α, 1, 2}, 
 FrameLabel -> {x, α}]

enter image description here

$\endgroup$
0
1
$\begingroup$

This differential equation is quite simple. So you can solve it analytically.

y[x_, α_] = FullSimplify[y[x] /. First@
DSolve[{α*y'''[x] + 8 y''[x] + 17 y'[x] + 10 y[x] == 0, 
        y[0] == 6*α, y'[0] == -20, y''[0] == 84}, y, x], 0 >= x <= 1 && 1 <= α <= 2]

The is result not shown here.

And plot the DensityPlot

DensityPlot[y[x, α], {x, 0, 1}, {α, 1, 2}]
$\endgroup$

Your Answer

By clicking “Post Your Answer”, you agree to our terms of service and acknowledge you have read our privacy policy.

Not the answer you're looking for? Browse other questions tagged or ask your own question.