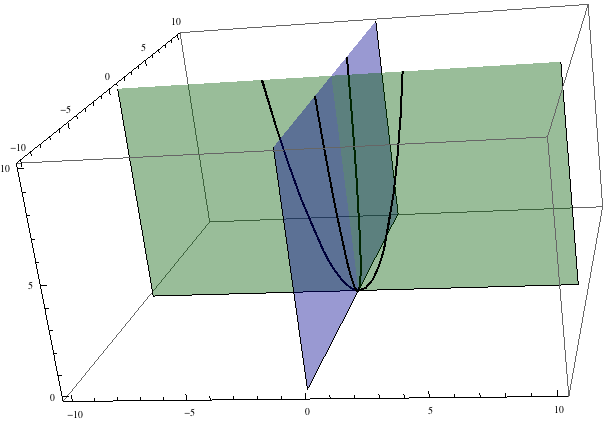
I would like to plot two 2d functions in a 3d coordinate system. Examples are z = x^2 and z = y^2. Each function has one independent variable, (either x or y), and a global dependent variable (z).
1 Answer
$\begingroup$
$\endgroup$
3
For the two curves use the command:
g1 = ParametricPlot3D[{{t, 0, t^2}, {0, u, u^2}}, {t, -10,10}, {u, -10, 10},
     BoundaryStyle -> Thick];
in addition, if you want also to have the two $x-y$ and $y-z$ planes in the plot:
planes = ContourPlot3D[{x == 0, y == 0}, {x, -10, 10}, {y, -10, 10}, {z,0, 100},
         Mesh -> False, ContourStyle -> {Directive[Blue, Opacity[0.4]],
         Directive[Green, Opacity[0.4]]}];

Show[g1,planes,PlotRange->{All,All,{-10,10}}]
-
$\begingroup$ many, many thanks. that's what i am looking for! $\endgroup$– pauleckCommented Apr 20, 2013 at 20:29
-
$\begingroup$ @pauleck, if this answers your question you should click on the check mark and the up-arrow next to the answer (to up-vote it - as I just did...) If you still want to wait for other answers, it's OK to leave the check mark unchecked until a day or so later. $\endgroup$– JensCommented Apr 20, 2013 at 21:03
-
$\begingroup$ @Jens, OP has rep $1$; unless he is given rep (say, by upvoting his question), he won't be able to upvote Spawn's answer. He can certainly accept Spawn's answer, if it suits his needs. $\endgroup$ Commented Apr 21, 2013 at 0:26


Plot3D[]already? $\endgroup$Plot3D[x^2+y^2,{x,-1,1},{y,-1,1}]? $\endgroup$Plot3D[{x^2, y^2}, {x, -2, 2}, {y, -2, 2}]works for me... $\endgroup$