4
$\begingroup$

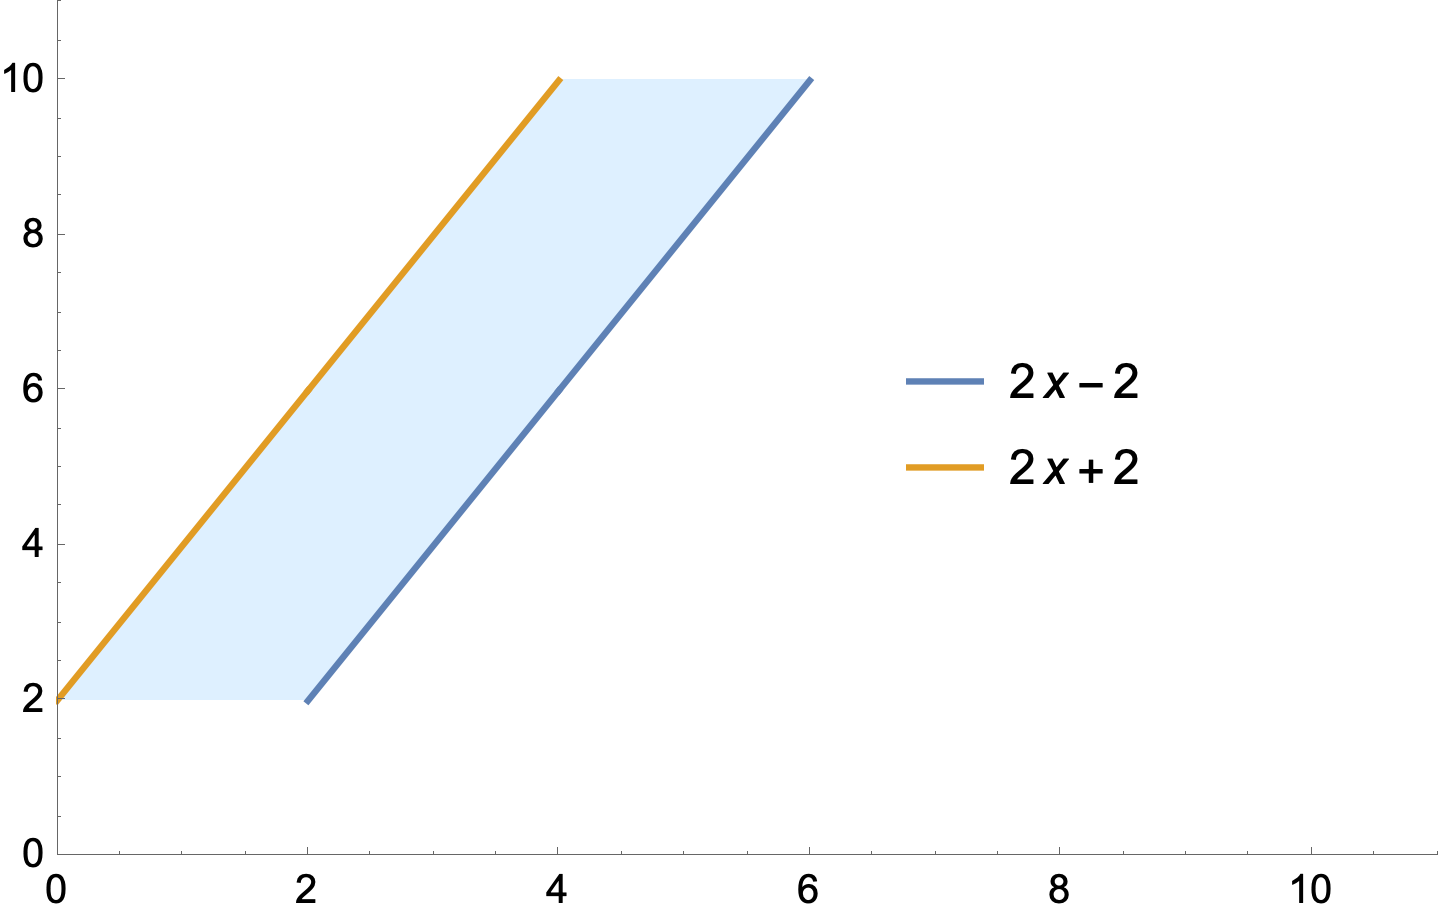
enter image description hereI'm a beginner at Mathematica, and I'm trying to figure out how to fill between two lines horizontally. Consider the toy example

Plot[{ConditionalExpression[2*x - 2, 2 < x < 6], ConditionalExpression[2*x + 2, x < 4]}, {x, 0, 10}, PlotRange -> {{0, 11}, {0, 11}}, Filling -> {1 -> {2}}]

Is there some easy way to fill horizontally between the two lines (so the whole area between the lines from y=2 to y=10 in the example is filled)? This whole thing is to be embedded in a bigger plot, so I cant for example add points outside of this plot to extend the top line and thus the coloring.

$\endgroup$
6
  • $\begingroup$ The Filling option would be where to start, but it seems you've already discovered that. Since we can't reproduced your plot without the data, it's hard to understand what the problem is. $\endgroup$
    – lericr
    Commented Oct 25, 2022 at 17:23
  • $\begingroup$ @lericr I just put what I have for reference. Instead of the data I made up that example which has the same problem. If I could make it work for the toy example, I believe it could be applied to my case as well. I suppose I could remove my real case and consider the example, I'm not sure how I could share the data easily. $\endgroup$
    – sb59
    Commented Oct 25, 2022 at 17:29
  • 1
    $\begingroup$ Oh, I see. Since I couldn't evaluate the first bit I didn't even look at the second bit. For future reference, it's just really difficult to read minds, so posting examples that don't actually produce any output to analyze makes it very difficult to answer questions. Anyway... $\endgroup$
    – lericr
    Commented Oct 25, 2022 at 18:08
  • 1
    $\begingroup$ Two suggestions: First, just extend your functions so that they both are defined for the whole domain of the plot. Second, maybe compute the fill region yourself as a polygon and overlay that on the plot (e.g. with Epilog or Prolog). $\endgroup$
    – lericr
    Commented Oct 25, 2022 at 18:11
  • $\begingroup$ @lericr Thanks for the suggestions. I managed to overlay a polygon to get the job done in this simple case, but I cant get it to work in my original case where the axes were logarithmic (at least I think that might be why it doesnt work). Maybe I should ask a new question later about my specific case with the data available.. $\endgroup$
    – sb59
    Commented Oct 25, 2022 at 19:29

3 Answers 3

8
$\begingroup$
$Version

(* "13.1.0 for Mac OS X x86 (64-bit) (June 16, 2022)" *)

Clear["Global`*"]

Split each of the lines into two segments and cycle the PlotStyle

Plot[{
  ConditionalExpression[2*x - 2, 2 < x < 4],
  ConditionalExpression[2*x + 2, 0 < x < 2],
  ConditionalExpression[2*x - 2, 4 < x < 6],
  ConditionalExpression[2*x + 2, 2 < x < 4]},
 {x, 0, 10},
 PlotRange -> {{0, 11}, {0, 11}},
 Filling -> {1 -> {4}, 2 -> 2, 3 -> 10},
 FillingStyle -> LightBlue,
 PlotStyle -> (ColorData[97] /@ {1, 2}),
 PlotLegends -> Placed[
   {HoldForm[2*x - 2], HoldForm[2*x + 2], None, None},
   {.7, .5}]]

enter image description here

$\endgroup$
1
  • $\begingroup$ Thanks, this works well and is the simplest out of all the good answers for me to understand. $\endgroup$
    – sb59
    Commented Oct 26, 2022 at 11:40
6
$\begingroup$

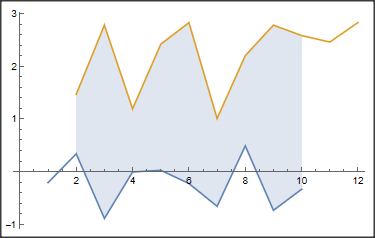
Something like:

dat1 = Table[ {i, RandomReal[{-1, 1}]}, {i, 10}];
dat2 = Table[ {i, 2 + RandomReal[{-1, 1}]}, {i, 2, 12}];
ListLinePlot[{dat1, dat2}, Filling -> {1 -> {2}}]

enter image description here

Addendum

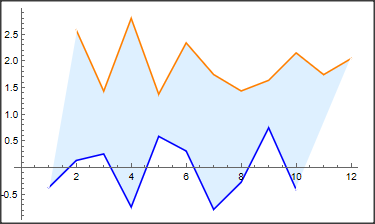
If you want the shading to connect the first points and the last points, it gets a bit more complex:

SeedRandom[4];
dat1 = Table[{i, RandomReal[{-1, 1}]}, {i, 10}];
dat2 = Table[{i, 2 + RandomReal[{-1, 1}]}, {i, 2, 12}];

ListLinePlot[{dat1, 
  dat2, {dat1[[1]], dat2[[1]]}, {dat1[[-1]], dat2[[-1]]}}, 
 Filling -> {1 -> {{2}, 
     LightBlue}, {1 -> {{3}, {LightBlue, 
       LightBlue}}}, {2 -> {{4}, {LightBlue, LightBlue}}}}, 
 PlotStyle -> {Blue, Orange, White, White}]

enter image description here

$\endgroup$
4
  • $\begingroup$ Thanks for the response. I dont see how this answers my question though, as far as I can see, it is the same thing as what I have. The filling stops when the lines stop sharing x values, which I believe is my issue. $\endgroup$
    – sb59
    Commented Oct 25, 2022 at 16:35
  • $\begingroup$ Please give an example of what you want, eventually a hand drawing. How should the filling be if there are x values only for one curve? $\endgroup$ Commented Oct 25, 2022 at 17:27
  • $\begingroup$ I have added a hand drawing of what I mean. $\endgroup$
    – sb59
    Commented Oct 25, 2022 at 17:34
  • $\begingroup$ I added an example according to you hand drawing. $\endgroup$ Commented Oct 25, 2022 at 18:31
6
$\begingroup$
  • construct two lines to make a closed curve and then use BoundaryDiscretizeGraphics to get a region.
Clear[f, g, plot1, plot2, pts1, pts2, reg];
f[x_] = ConditionalExpression[2*x - 2, 2 < x < 6];
g[x_] = ConditionalExpression[2*x + 2, x < 4];
plot1 = Plot[f[x], {x, 0, 10}, PlotStyle -> Red];
plot2 = Plot[g[x], {x, 0, 10}, PlotStyle -> Green];
pts1 = Cases[plot1, Line[pts_] :> pts, Infinity][[1]];
pts2 = Cases[plot2, Line[pts_] :> pts, Infinity][[1]];
reg = Graphics[{Line[pts1], Line[pts2], 
     Line[{pts1[[-1]], pts2[[-1]]}], Line[{pts1[[1]], pts2[[1]]}]}] //
    BoundaryDiscretizeGraphics;
Show[reg, plot1, plot2, Axes -> True]
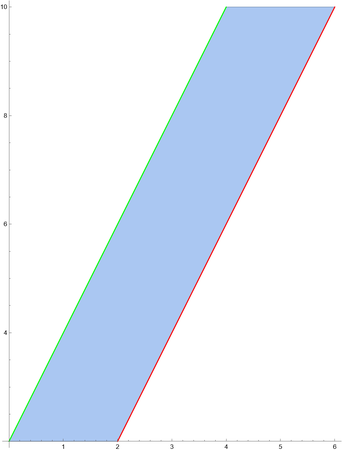
enter image description here

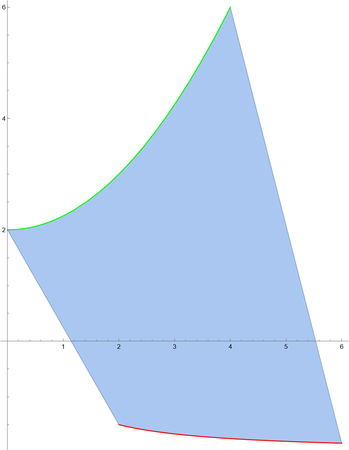
  • test another two functions which does not intersection each other.
Clear[f, g, plot1, plot2, pts1, pts2, reg];
f[x_] = ConditionalExpression[1/x - 2, 2 < x < 6];
g[x_] = ConditionalExpression[1/4 x^2 + 2, x < 4];
plot1 = Plot[f[x], {x, 0, 10}, PlotStyle -> Red];
plot2 = Plot[g[x], {x, 0, 10}, PlotStyle -> Green];
pts1 = Cases[plot1, Line[pts_] :> pts, Infinity][[1]];
pts2 = Cases[plot2, Line[pts_] :> pts, Infinity][[1]];
reg = Graphics[{Line[pts1], Line[pts2], 
     Line[{pts1[[-1]], pts2[[-1]]}], Line[{pts1[[1]], pts2[[1]]}]}] //
    BoundaryDiscretizeGraphics;
Show[reg, plot1, plot2, Axes -> True]
enter image description here

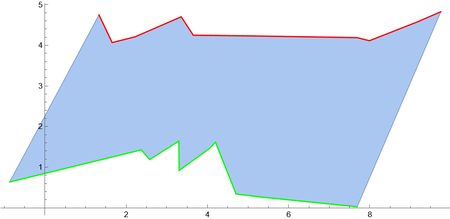
  • for ListPlot.
Clear[pts1, pts2, graphics, reg]
SeedRandom[1];
pts1 = SortBy[RandomPoint[Rectangle[{-1, 4}, {10, 5}], 10], First];
pts2 = SortBy[RandomPoint[Rectangle[{-1, 0}, {10, 2}], 10], First];
graphics = 
  Graphics[{Line[pts1], Line[pts2], Line[{pts1[[-1]], pts2[[-1]]}], 
    Line[{pts1[[1]], pts2[[1]]}]}];
reg = graphics // BoundaryDiscretizeGraphics;
Show[reg, ListLinePlot[{pts1, pts2}, PlotStyle -> {Red, Green}], 
 Axes -> True]
enter image description here

$\endgroup$

Your Answer

By clicking “Post Your Answer”, you agree to our terms of service and acknowledge you have read our privacy policy.

Not the answer you're looking for? Browse other questions tagged or ask your own question.