0
$\begingroup$

It's as simple as the title says. My code is:

b1 = 2 Pi/a {1/Sqrt[3], 1, 0};
b2 = 2 Pi/a {1/Sqrt[3], -1, 0};
b3 = -2 Pi/c {0, 0, 1};

KK[n1_, n2_, n3_] = n1 b1 + n2 b2 + n3 b3;

lista1 = Table[{KK[n1, n2, n3], b1}, {n1, 0, 5, 1}, {n2, 0, 5, 
    1}, {n3, 0, 5, 1}];

reemp = {a -> 2, c -> 1};

l1 = lista1 /. reemp;
l2 = lista2 /. reemp;
l3 = lista3 /. reemp;

ListVectorPlot3D[l1, VectorPoints -> All]

I compare it whith the manual's ("Get Help" option) working example:

vectors = Table[{{x, y, z}, {y, x - x^3, z}}, {x, -1.5, 1.5, 0.2}, {y, -2, 2,0.2}, {z, -1, 1,0.1}];
ListVectorPlot3D[vectors];

but can't find any significant difference in terms of code. Also tried using the option "VectorPoints -> All", but with no avail. I read some past answers but found nothing i could use. The most similar question i could find is this 8-year-old wolfram's forum question

but there they don't really solve the problem. Maybe nowadays there's finally an answer!

EDIT: the idea is to have the vectors $b_i$ plotted at KK sites

Forgot to mention that i also tried this other implementation that does plot something, but not what i want...the vectors doesn't seem to be located at the points positions

n1max = 3 ; n2max = 3 ; n3max = 3;
pason1 = 1; pason2 = 1; pason3 = 1;

posiciones = Flatten[Table[KK[n1, n2, n3], {n1, 0, n1max, pason1}, {n2, 0, n2max,pason2}, {n3, 0, n3max, pason3}], 2];

lista1 = Table[b1, {n1, 0, n1max, pason1}, {n2, 0, n2max, pason2}, {n3, 0, n3max,pason3}];

reemp = {a -> 2, c -> 1};

l1 = lista1 /. reemp;
l2 = lista2 /. reemp;
l3 = lista3 /. reemp;

prom = Mean[{2 Pi/a, 2 Pi/c} /. reemp];

g1 = ListPointPlot3D[posiciones /. reemp];
gv1 = ListVectorPlot3D[l1,DataRange -> {{0, n1max Norm[b1]}, {0, n2max Norm[b2]}, {0,n3max Norm[b3]}} /. reemp, VectorScale -> Small];
Show[g1, gv1]

Also I'd like the arrows to start at the position dots and extend to the corresponding next dots... something like: o->o

$\endgroup$
3
  • $\begingroup$ Your list l1 has wrong dimensions. Try: Dimensions[l1] what gives {6, 6, 6, 2, 3}. It should e.g. be {6,6,6,3} $\endgroup$ Commented Oct 9, 2022 at 20:09
  • $\begingroup$ @DanielHuber, I don't think this is the problem. The second example in the documentation for ListVectorPlot3D also has dimensions {16, 21, 21, 2, 3} (you provide {{x, y, z}, {dx, dy, dz}}). $\endgroup$
    – Domen
    Commented Oct 9, 2022 at 20:12
  • $\begingroup$ Sorry, you are right, I overlooked the possibility with dx,dy,dz $\endgroup$ Commented Oct 9, 2022 at 21:05

1 Answer 1

0
$\begingroup$

The third bullet point in the documentation for ListVectorPlot3D states:

ListVectorPlot3D by default interpolates the data given and plots vectors for the vector field at a regular 3D grid of positions.

Diving into the code for ListVectorPlot3D reveals that it uses Interpolation on the (reshaped) data. For example:

regularGrid = Table[{{x, y, z}, {1, 1, 1}}, {x, 5}, {y, 5}, {z, 5}];
irregularGrid = Table[{{x, 2 x + y, z}, {1, 1, 1}}, {x, 5}, {y, 5}, {z, 5}];

Interpolation[Flatten[regularGrid, {{1, 2, 3}}]]
(* Works as expected *)

Interpolation[Flatten[irregularGrid, {{1, 2, 3}}]]
(* Interpolation::udeg : Interpolation on unstructured grids is currently only supported 
   for InterpolationOrder->1 or InterpolationOrder->All. Order will be reduced to 1 *)

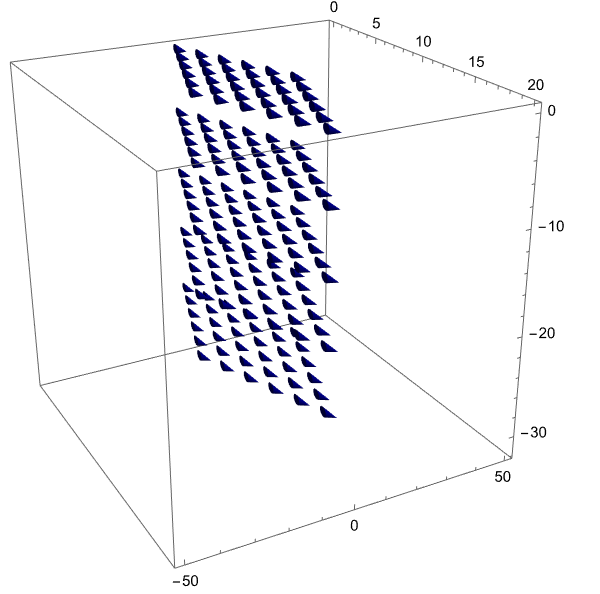
Even by changing InterpolationOrder->All in the code, I did not manage to produce a plot. Luckily, however, you don't really want any interpolation because you are plotting a constant vector field. Therefore, you can simply use VectorPlot3D together with VectorPoints.

b1 = 2 Pi/a {1/Sqrt[3], 1, 0};
b2 = 2 Pi/a {1/Sqrt[3], -1, 0};
b3 = -2 Pi/c {0, 0, 1};
reemp = {a -> 2, c -> 1};

vp[n1_, n2_, n3_] := n1 b1 + n2 b2 + n3 b3;
vps = Flatten[
        Table[vp[n1, n2, n3], {n1, 0, 5, 1}, {n2, 0, 5, 1}, {n3, 0, 5, 1}], 
      {{1, 2, 3}}] /. reemp;

VectorPlot3D[b1 /. reemp, {x, 0, 20}, {y, -50, 50}, {z, -30, 0}, VectorPoints -> vps]

enter image description here

$\endgroup$
3
  • $\begingroup$ Does this mean ListVectorPlot3D is broken or something? is it worth notifying wolfram for fixing? $\endgroup$
    – Ethan1987
    Commented Oct 10, 2022 at 21:28
  • $\begingroup$ I wouldn't say there is anything broken. The function just doesn't seem to (currently) support irregular grids ... $\endgroup$
    – Domen
    Commented Oct 11, 2022 at 0:01
  • $\begingroup$ I'm having extremely rare behaviour of VectorPlot3D. it draws huge vectors that get off grid, even using options to scale them down...why is this happening to me?? no errors so far ``` VectorPlot3D[{b1, b2, b3} /. reemp, {x, 0, 20}, {y, -50, 50}, {z, -30, 0}, VectorPoints -> vps, VectorScale -> 0.0005, VectorStyle -> Arrowheads[{0.0004, .9}]]``` $\endgroup$
    – Ethan1987
    Commented Oct 13, 2022 at 15:21

Your Answer

By clicking “Post Your Answer”, you agree to our terms of service and acknowledge you have read our privacy policy.

Not the answer you're looking for? Browse other questions tagged or ask your own question.