3
$\begingroup$

I think the current answer just creates a GIF but doesn't explain why LocalizeVariables -> False would cause an abnormal GIF to be exported. And I don't see any explanation about this phenomenon in the documentation. I don't sure this is a bug or not. So I hope to reopen this post.


Code:

g1 = Manipulate[Plot[{Log[x], (x^(1-a)-1)/(1-a)}, {x, 0, 5}, PlotLegends->"Expressions"], 
{a, 0, 0.99}, LocalizeVariables->False];

Export["isoelastic.gif",g1]

Output (GIF):

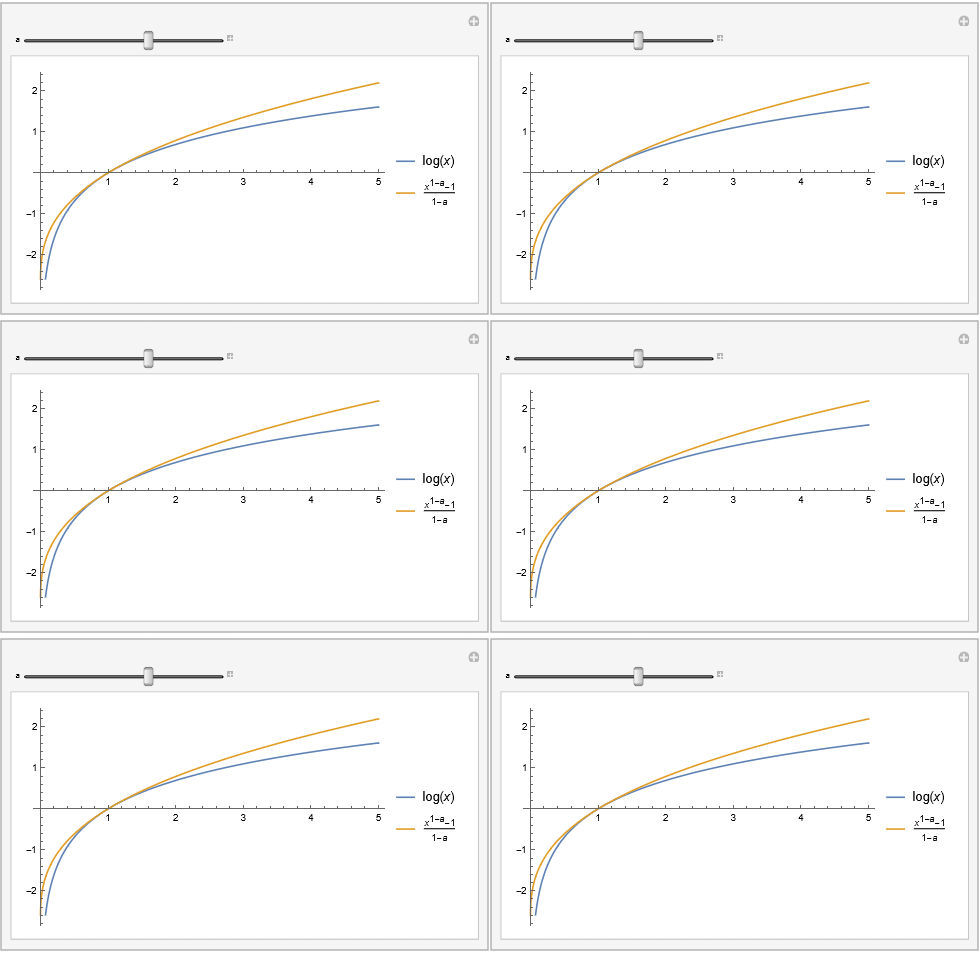
enter image description here

As you can see, the .gif is just a static image. Any ideas?


EDIT:

But this code worked perfectly fine:

a1 = Manipulate[Plot[{(1-t)*x - t*((E^(-t*x)) - 1)}, {x, -100, 100}], {t, 0, 1}]

Export["graph.gif", a1]

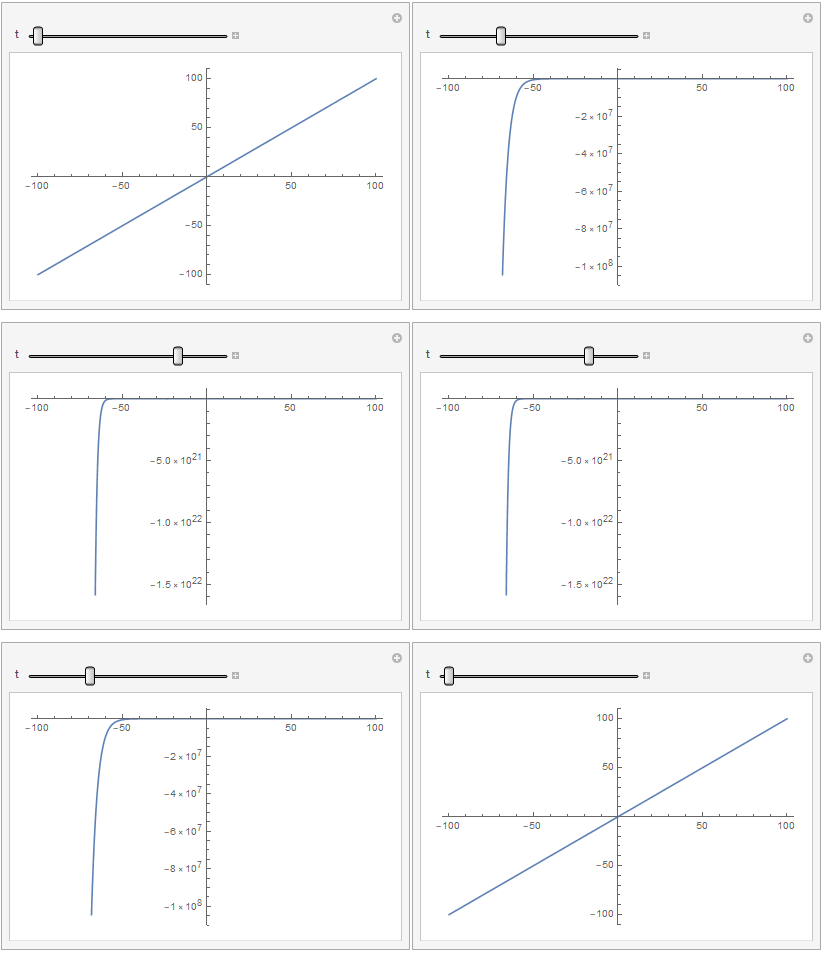
Output:

enter image description here

$\endgroup$
1
  • $\begingroup$ How to export without the nasty panel and controls $\endgroup$
    – user5601
    Commented Jan 19, 2022 at 17:43

1 Answer 1

3
$\begingroup$

That's because when exporting to a gif, it actually takes a list of images. So what you actually want is

g1 = Table[
      Plot[{Log[x], (x^(1 - a) - 1)/(1 - a)}, {x, 0, 5}, PlotLegends -> "Expressions"],
      {a, 0, 0.99, .99/100}
     ]
$\endgroup$
2
  • 1
    $\begingroup$ Makes sense! I've edited my question - do you know why the code snippet below worked? (I've already accepted your answer even if you don't know). $\endgroup$
    – Thev
    Commented Oct 20, 2018 at 20:09
  • $\begingroup$ You do output the animation, but you don't explain why the op's code doesn't output the animation. I don't see anything official stating that LocalizeVariables prevents outputting animations $\endgroup$
    – yode
    Commented Jan 18, 2022 at 9:43

Your Answer

By clicking “Post Your Answer”, you agree to our terms of service and acknowledge you have read our privacy policy.

Not the answer you're looking for? Browse other questions tagged or ask your own question.