Tweeted twitter.com/StackMma/status/1483499439813763073
Post Reopened by yode, MarcoB, cvgmt, Artes, Karsten7
added 15 characters in body
Source Link
yode
  • 27.2k
  • 4
  • 66
  • 174

I think the current answer just creates a GIF but doesn't explain why LocalizeVariables -> False would cause an abnormal GIF to be exported. And I don't see any explanation about this phenomenon in the documentation. I don't sure this is a bug or not. So I hope to reopen this post.


Code:

g1 = Manipulate[Plot[{Log[x], (x^(1-a)-1)/(1-a)}, {x, 0, 5}, PlotLegends->"Expressions"], 
{a, 0, 0.99}, LocalizeVariables->False];

Export["isoelastic.gif",g1]

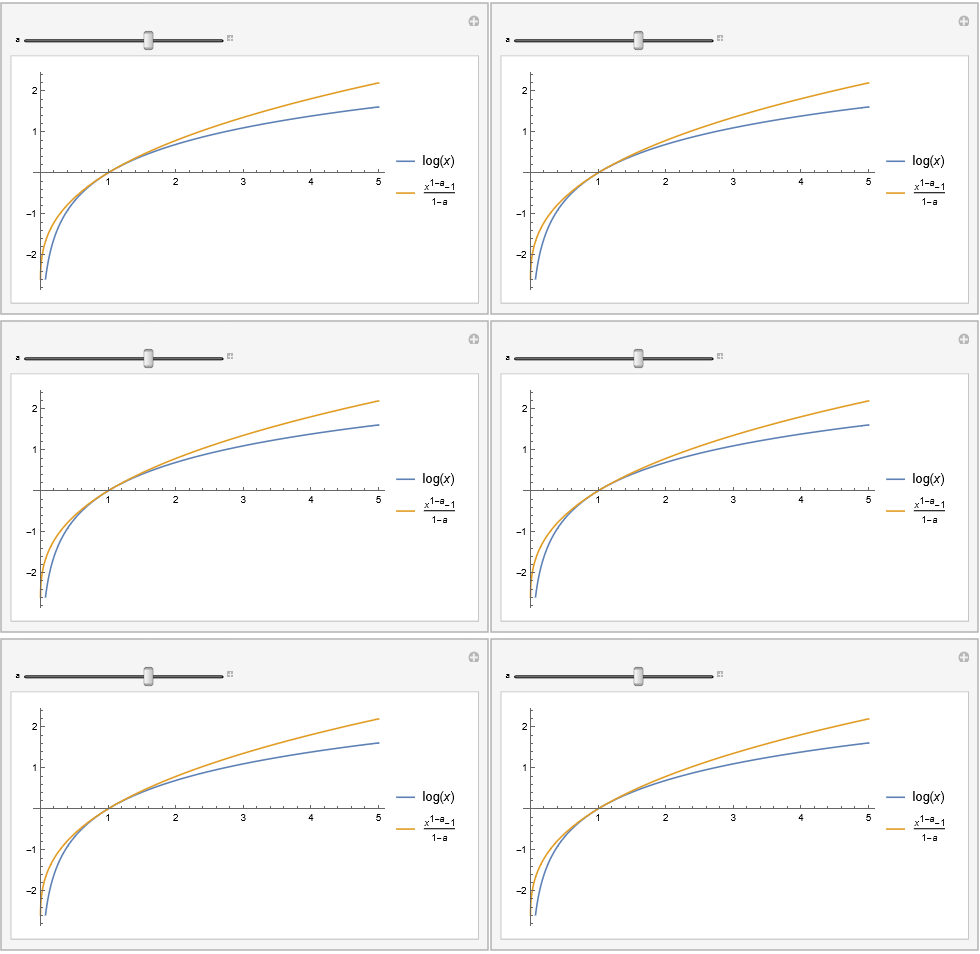
Output (GIF):

enter image description here

As you can see, the .gif is just a static image. Any ideas?


EDIT:

But this code worked perfectly fine:

a1 = Manipulate[Plot[{(1-t)*x - t*((E^(-t*x)) - 1)}, {x, -100, 100}], {t, 0, 1}]

Export["graph.gif", a1]

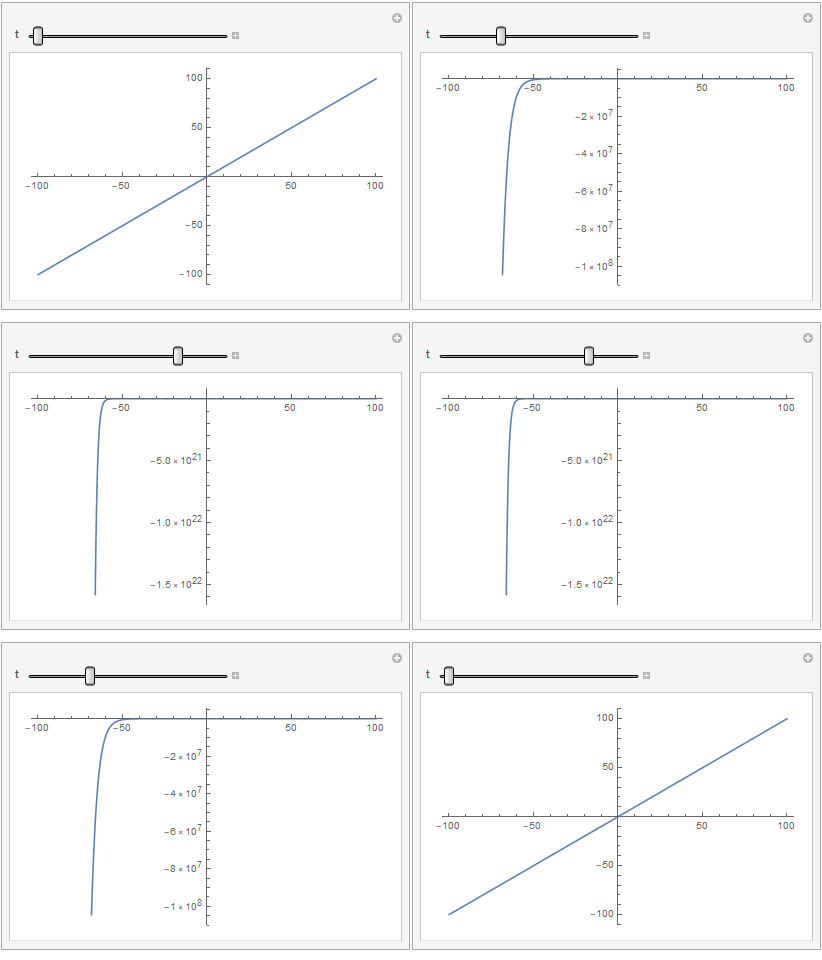
Output:

enter image description here

I think the current answer just creates a GIF but doesn't explain why LocalizeVariables -> False would cause an abnormal GIF to be exported. I don't see any explanation about this in the documentation. I don't sure this is a bug or not. So I hope to reopen this post.


Code:

g1 = Manipulate[Plot[{Log[x], (x^(1-a)-1)/(1-a)}, {x, 0, 5}, PlotLegends->"Expressions"], 
{a, 0, 0.99}, LocalizeVariables->False];

Export["isoelastic.gif",g1]

Output (GIF):

enter image description here

As you can see, the .gif is just a static image. Any ideas?


EDIT:

But this code worked perfectly fine:

a1 = Manipulate[Plot[{(1-t)*x - t*((E^(-t*x)) - 1)}, {x, -100, 100}], {t, 0, 1}]

Export["graph.gif", a1]

Output:
enter image description here

I think the current answer just creates a GIF but doesn't explain why LocalizeVariables -> False would cause an abnormal GIF to be exported. And I don't see any explanation about this phenomenon in the documentation. I don't sure this is a bug or not. So I hope to reopen this post.


Code:

g1 = Manipulate[Plot[{Log[x], (x^(1-a)-1)/(1-a)}, {x, 0, 5}, PlotLegends->"Expressions"], 
{a, 0, 0.99}, LocalizeVariables->False];

Export["isoelastic.gif",g1]

Output (GIF):

enter image description here

As you can see, the .gif is just a static image. Any ideas?


EDIT:

But this code worked perfectly fine:

a1 = Manipulate[Plot[{(1-t)*x - t*((E^(-t*x)) - 1)}, {x, -100, 100}], {t, 0, 1}]

Export["graph.gif", a1]

Output:
enter image description here

added 51 characters in body
Source Link
yode
  • 27.2k
  • 4
  • 66
  • 174

I think the current answer just creates a GIF andbut doesn't explain why LocalizeVariables -> False would cause an abnormal GIF to be exported, and. I don't see thatany explanation about this in the help documentation. I don't sure this is a bug or not. So I hope to reopen this post.


Code:

g1 = Manipulate[Plot[{Log[x], (x^(1-a)-1)/(1-a)}, {x, 0, 5}, PlotLegends->"Expressions"], 
{a, 0, 0.99}, LocalizeVariables->False];

Export["isoelastic.gif",g1]

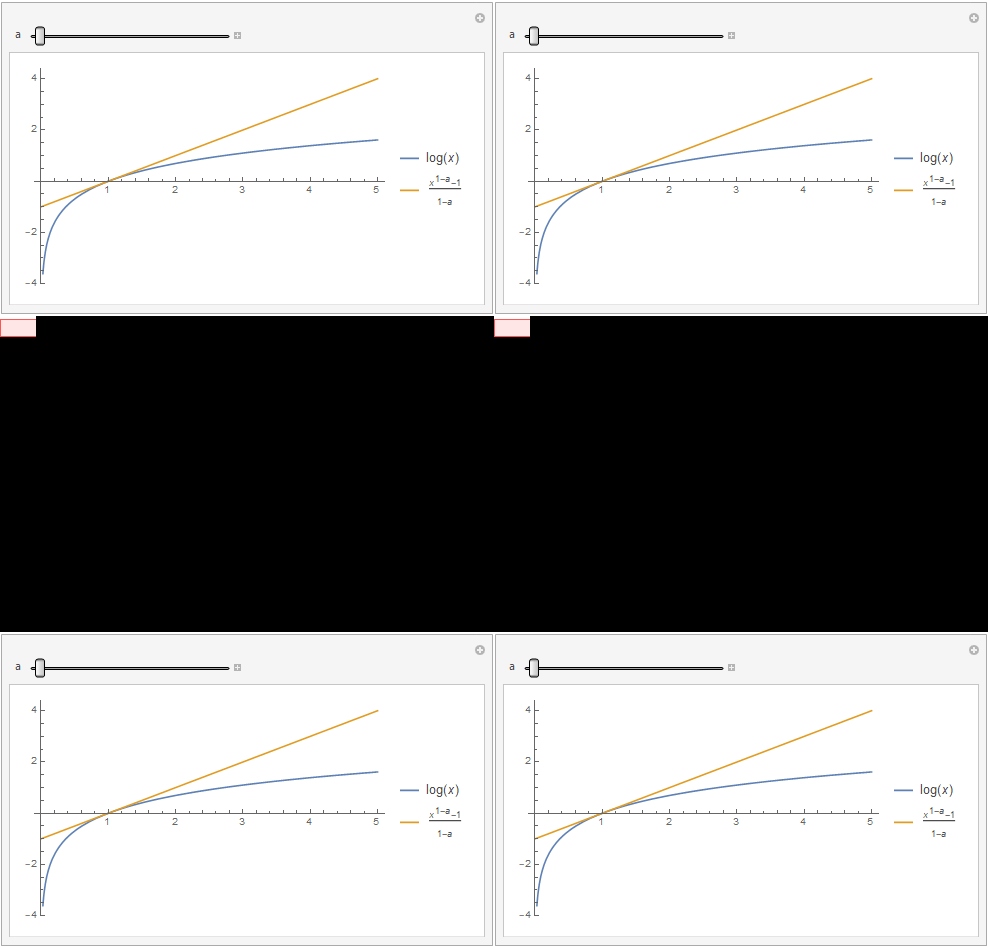
Output (GIF):

enter image description here

As you can see, the .gif is just a static image. Any ideas?


EDIT:

But this code worked perfectly fine:

a1 = Manipulate[Plot[{(1-t)*x - t*((E^(-t*x)) - 1)}, {x, -100, 100}], {t, 0, 1}]

Export["graph.gif", a1]

Output:
enter image description here

I think the current answer just creates a GIF and doesn't explain why LocalizeVariables -> False would cause an abnormal GIF to be exported, and I don't see that in the help documentation. I don't sure this is a bug or not. So I hope to reopen this post.


Code:

g1 = Manipulate[Plot[{Log[x], (x^(1-a)-1)/(1-a)}, {x, 0, 5}, PlotLegends->"Expressions"], 
{a, 0, 0.99}, LocalizeVariables->False];

Export["isoelastic.gif",g1]

Output (GIF):

enter image description here

As you can see, the .gif is just a static image. Any ideas?


EDIT:

But this code worked perfectly fine:

a1 = Manipulate[Plot[{(1-t)*x - t*((E^(-t*x)) - 1)}, {x, -100, 100}], {t, 0, 1}]

Export["graph.gif", a1]

Output:

enter image description here

I think the current answer just creates a GIF but doesn't explain why LocalizeVariables -> False would cause an abnormal GIF to be exported. I don't see any explanation about this in the documentation. I don't sure this is a bug or not. So I hope to reopen this post.


Code:

g1 = Manipulate[Plot[{Log[x], (x^(1-a)-1)/(1-a)}, {x, 0, 5}, PlotLegends->"Expressions"], 
{a, 0, 0.99}, LocalizeVariables->False];

Export["isoelastic.gif",g1]

Output (GIF):

enter image description here

As you can see, the .gif is just a static image. Any ideas?


EDIT:

But this code worked perfectly fine:

a1 = Manipulate[Plot[{(1-t)*x - t*((E^(-t*x)) - 1)}, {x, -100, 100}], {t, 0, 1}]

Export["graph.gif", a1]

Output:

enter image description here

added 51 characters in body
Added to review
Source Link
yode
  • 27.2k
  • 4
  • 66
  • 174

I think the current answer just creates a GIF and doesn't explain why LocalizeVariables -> False would cause an abnormal GIF to be exported, and I don't see that in the help documentation. I don't sure this is a bug or not. So I hope to reopen this post.


Code:

g1 = Manipulate[Plot[{Log[x], (x^(1-a)-1)/(1-a)}, {x, 0, 5}, PlotLegends->"Expressions"], 
{a, 0, 0.99}, LocalizeVariables->False]

ListAnimate[g1]
>False];
SetDirectory[NotebookDirectory[]]
Export["isoelastic.gif",g1]

Output (GIF):

enter image description hereenter image description here

As you can see, the .gif output does not show the animation at all (itis just 'flashes')a static image. Any ideas?


EDIT:

I'm wondering whyBut this code, which is basically identical to the above, worked perfectly fine:

a1 = Manipulate[Plot[{(1-t)*x - t*((E^(-t*x)) - 1)}, {x, -100, 100}], {t, 0, 1}]
 
ListAnimate[a1]

SetDirectory[NotebookDirectory[]]
Export["graph.gif", a1]

Output:

enter image description here

Code:

g1 = Manipulate[Plot[{Log[x], (x^(1-a)-1)/(1-a)}, {x, 0, 5}, PlotLegends->"Expressions"], 
{a, 0, 0.99}, LocalizeVariables->False]

ListAnimate[g1]

SetDirectory[NotebookDirectory[]]
Export["isoelastic.gif",g1]

Output (GIF):

enter image description here

As you can see, the .gif output does not show the animation at all (it just 'flashes'). Any ideas?


EDIT:

I'm wondering why this code, which is basically identical to the above, worked perfectly fine:

a1 = Manipulate[Plot[{(1-t)*x - t*((E^(-t*x)) - 1)}, {x, -100, 100}], {t, 0, 1}]
 
ListAnimate[a1]

SetDirectory[NotebookDirectory[]]
Export["graph.gif", a1]

Output:

enter image description here

I think the current answer just creates a GIF and doesn't explain why LocalizeVariables -> False would cause an abnormal GIF to be exported, and I don't see that in the help documentation. I don't sure this is a bug or not. So I hope to reopen this post.


Code:

g1 = Manipulate[Plot[{Log[x], (x^(1-a)-1)/(1-a)}, {x, 0, 5}, PlotLegends->"Expressions"], 
{a, 0, 0.99}, LocalizeVariables->False];

Export["isoelastic.gif",g1]

Output (GIF):

enter image description here

As you can see, the .gif is just a static image. Any ideas?


EDIT:

But this code worked perfectly fine:

a1 = Manipulate[Plot[{(1-t)*x - t*((E^(-t*x)) - 1)}, {x, -100, 100}], {t, 0, 1}]

Export["graph.gif", a1]

Output:

enter image description here

Post Closed as "Not suitable for this site" by Alexey Popkov, m_goldberg, rhermans, Kuba
edited tags
Link
Loading
added section
Source Link
Thev
  • 147
  • 5
Loading
Source Link
Thev
  • 147
  • 5
Loading