0
$\begingroup$

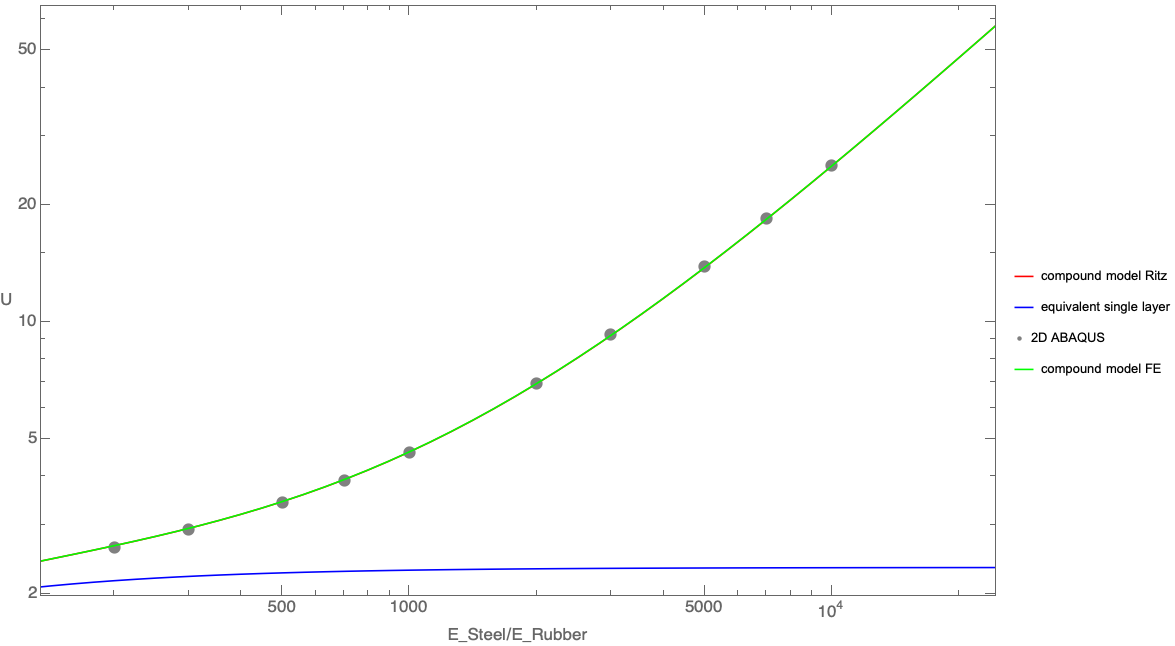
I have a plot that I made with the help of the show function. But I need to zoom in on this plot I tried once but it is not enough I need to zoom until I see the difference between gray dots green line and red line but unfortunately I can not do it is there any idea how to do it? p1 p2 p4 p5 are plots of some results!

 p8 = Show[{p1, p2, p4, p5}, Frame -> True, FrameLabel -> {"E_Steel/E_Rubber", "U"}, RotateLabel -> False, 
  Axes -> False, 
  FrameStyle -> Directive[FontSize -> 17, FontFamily -> "Helvetica"], 
  PlotRange -> {{5, 10}, {0.75, 4}}, ImageSize -> 1000]
Export["EnergieZoomed.png", p8]

enter image description here

$\endgroup$
7
  • $\begingroup$ Your code is not complete. $\endgroup$ Commented May 23, 2021 at 9:16
  • $\begingroup$ Thank you! Already edited. $\endgroup$ Commented May 23, 2021 at 10:25
  • $\begingroup$ Please post your code about p1,p2,p3,p4. $\endgroup$
    – cvgmt
    Commented May 23, 2021 at 10:44
  • $\begingroup$ The whole Code in wolfarmcloud $\endgroup$ Commented May 23, 2021 at 11:16
  • $\begingroup$ wolframcloud.com/obj/2aa28383-9a51-4ac9-894e-563dd1226e87 $\endgroup$ Commented May 23, 2021 at 11:27

1 Answer 1

0
$\begingroup$

First of all your p1 is not clear in graph despite i used Magnification.

So edit your p1 to be like this. you still can make Style no Thick

p1 = ListLogLogPlot[UvaluesAgainstYSteeltoYRubber, 
  AxesLabel -> {"E_Steel/e_Rubber", "U"}, PlotStyle -> {Thick, Red}, 
  PlotMarkers -> Automatic, 
     Joined -> True, PlotLegends -> {"compound model Ritz"}]

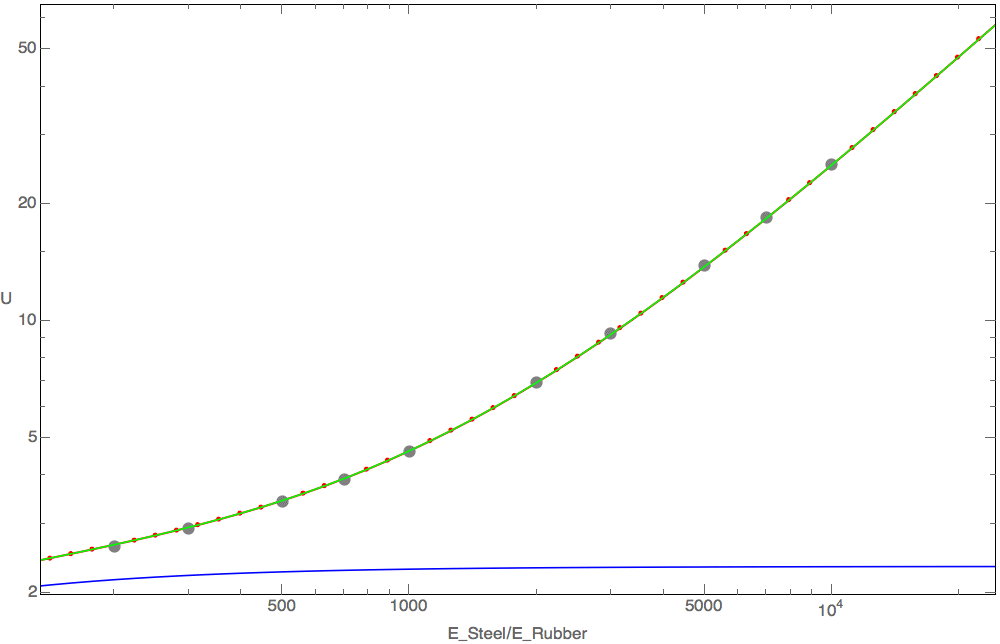
Now as you see that in p8 Show, its there !!!

enter image description here

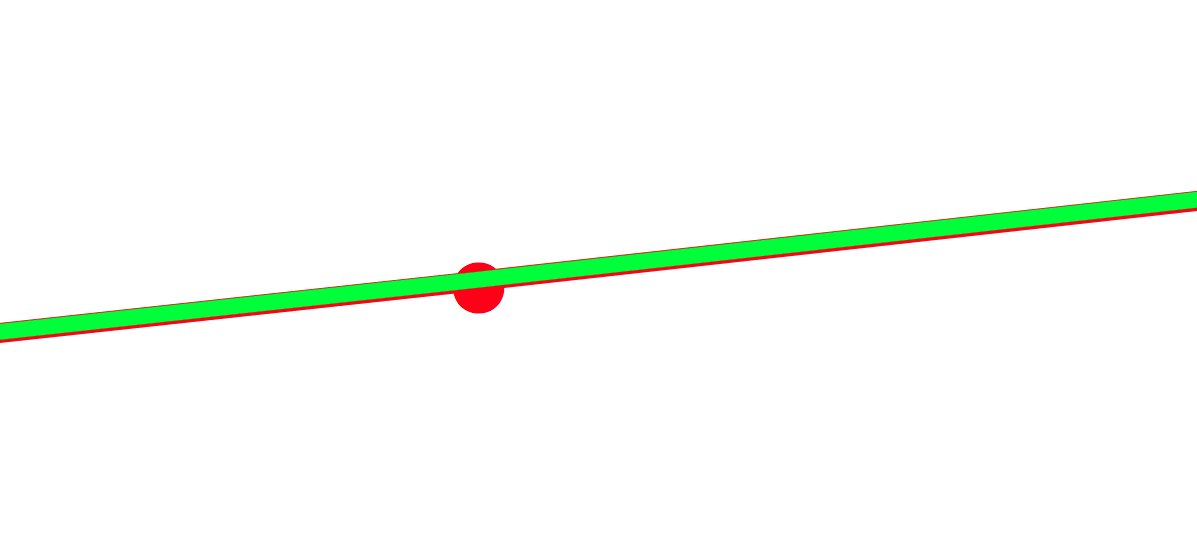
Now go ahead use little value of Magnify

Magnify[p8, 5]

enter image description here

Actually your Data and Curves are truly fitted on each other. Its means you are so pro in what ever experiment is this !

$\endgroup$
4
  • $\begingroup$ @ Ali AlCapone I think thats the solution to your problem. Just edit p1 and you are good to show red marks and line clearly $\endgroup$
    – Alrubaie
    Commented May 23, 2021 at 14:02
  • $\begingroup$ Thank you Very much. :D $\endgroup$ Commented May 23, 2021 at 14:05
  • $\begingroup$ @ Ali AlCapone you still can play around with plot range and magnify. but truly man your curves are fitted. Dont bother your self anymore. Enough to show this part and thats it $\endgroup$
    – Alrubaie
    Commented May 23, 2021 at 14:08
  • $\begingroup$ I see, thank you very much ;) Respect also for your programming talent $\endgroup$ Commented May 23, 2021 at 14:17

Your Answer

By clicking “Post Your Answer”, you agree to our terms of service and acknowledge you have read our privacy policy.

Not the answer you're looking for? Browse other questions tagged or ask your own question.