7
$\begingroup$

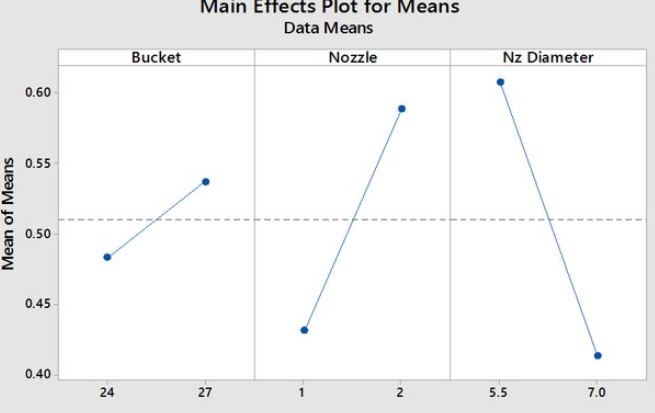
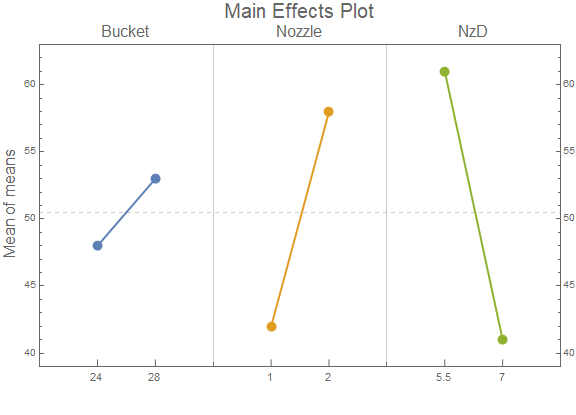
I'm trying to make a "main effect" type chart but I haven't found a way to do it in Mathematica. The main effect plots are the graphs plotting the means for each value of a categorical variable, ploted side by side. Example as follows.

Dataset:

Bucket = {{24, 48}, {28, 53}}
Nozzle = {{1, 42}, {2, 58}}
NzD = {{5.5, 61}, {7, 41}}

enter image description here

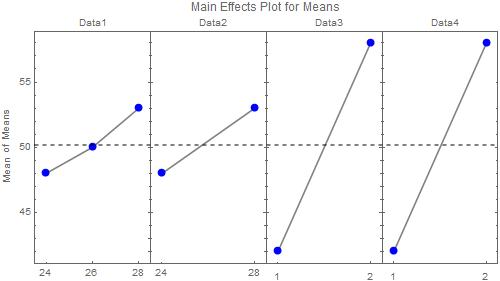
Thanks for the replies but I apologize for forgetting to specify that I can have more than 3 datasets (for example Dt4 = {{23, 50}, {26.55}, {28, 58}}) and that they can have more that two points. My knowledge of Mathematica does not allow me to fully understand the answers to make the necessary changes. However, all graphics (frames) must be the same width and height.

enter image description here

$\endgroup$
1
  • 4
    $\begingroup$ Can you include a dataset to play with? $\endgroup$
    – MarcoB
    Commented Mar 16, 2021 at 19:23

3 Answers 3

11
$\begingroup$

I find the resource function PlotGrid comes in handy when you want multiple plots side-by-side.

For the most part, I specify all of the options in a list beforehand so I don't have to type them over and over again. If we only want tick marks at the specified data, I have to specify the ticks for each one separately.

pg = ResourceFunction["PlotGrid"]
bucket = {{24, .48}, {27, .53}};
nozzle = {{1, .42}, {2, .58}};
nzd = {{5.5, .61}, {7, .41}};
opts = {Axes -> False, Frame -> True, Mesh -> All, 
   MeshStyle -> AbsolutePointSize[5], 
   PlotRangePadding -> {Scaled[0.1], Automatic}};
pg[{
  ListLinePlot[#, opts, 
     FrameTicks -> {{Automatic, Automatic}, {#[[All, 1]], 
        None}}] & /@ {bucket, nozzle, nzd}
  },
 AspectRatio -> 0.5,
 ImageSize -> 500,
 FrameLabel -> {None, "Mean of Means"},
 PlotLabel -> "Main Effects Plot for Means",
 PlotLabels -> 
  Placed[{"Bucket", "Nozzle", "Nz Diameter"}, Scaled[{0.56, 1.01}]],
 PlotRange -> Max,
 Epilog -> {
   Dashed,
   Line[{{0, 0.51}, {1, 0.51}}]
   }
 ]

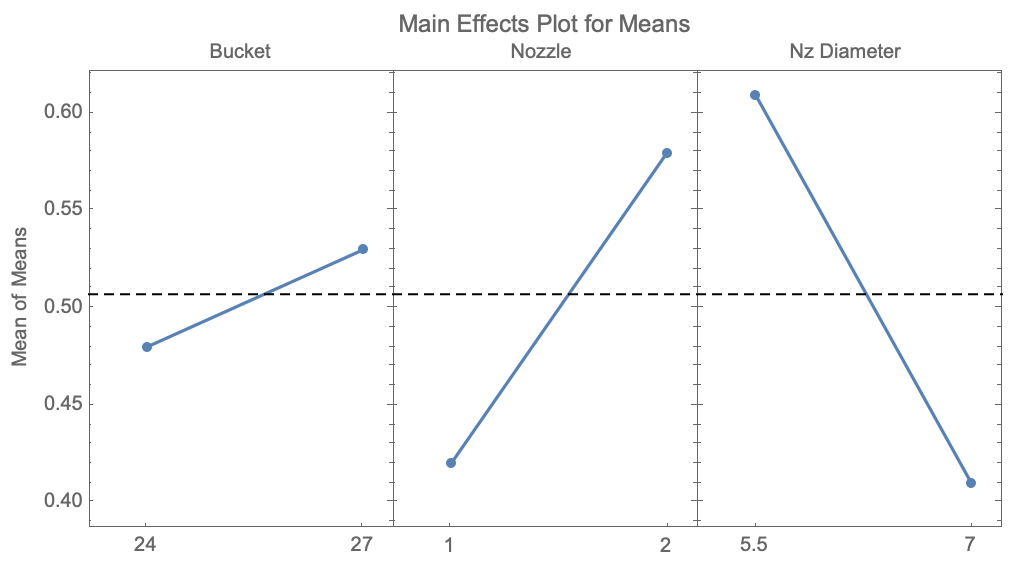
Main effects plot.

$\endgroup$
6
  • 1
    $\begingroup$ Strongly recommend PlotGrid! $\endgroup$
    – sunt05
    Commented Mar 16, 2021 at 20:59
  • $\begingroup$ Your solution is great. It allows any number of datasets and with different amount of values. But, for some reason, the values on the horizontal axis are misaligned. Indeed, if the values are one digit values (like the values 1 and 2 in the second graph) they are show lower than the values with two digits. What is the cause of this? Thank in advance. $\endgroup$ Commented Mar 17, 2021 at 21:44
  • $\begingroup$ @ALEXANDREARARIPE I'm not certain what the cause of that is. In the image above, at least, I think it's partly an optical illusion. I drew a line across the image and the 1 & 2 are lower by exactly 1 pixel. The 7 appears to be at exactly the same height as the 7 in 27. It might be due to the resolution. I exported a higher resolution version and as far as I can tell the numbers are at the exact same height. $\endgroup$
    – MassDefect
    Commented Mar 17, 2021 at 22:14
  • $\begingroup$ I don't think it's an optical illusion. In fact, I have attached an image of the graph obtained in the question area. If any of my values are single digits, the change occurs.Thank. $\endgroup$ Commented Mar 17, 2021 at 23:36
  • $\begingroup$ @ALEXANDREARARIPE Oh, I see. I thought you were referring to my graph. Yeah, the ones in your graph are definitely much lower. I couldn't say what is causing that without seeing the code. I haven't been able to replicate that behaviour in my own plots. $\endgroup$
    – MassDefect
    Commented Mar 18, 2021 at 0:03
4
$\begingroup$
ClearAll[mainEffectsPlot]

Options[mainEffectsPlot] = Join[Options[ListPlot], {Spacings -> Automatic}];

mainEffectsPlot[data_, labels_, opts : OptionsPattern[]] := 
 Module[{xcoords, means = Flatten@data[[All, All, -1]], 
    levels = Flatten@data[[All, All, 1]], 
    gap = OptionValue[Spacings] /. Automatic -> 1}, 
  xcoords = Accumulate @ Flatten[Prepend[gap]@
        Differences @ Subdivide[1, Max[Length /@ data], Length@# - 1] & /@ data]; 
  ListPlot[TakeList[Transpose[{xcoords, means}], Length /@ data], 
   Frame -> True, 
   GridLines -> {gap/2 + Most[Last /@ TakeList[xcoords, Length /@ data]], 
      {{Mean @ means,  Dashed}}}, 
   PlotRange -> All, 
   FilterRules[{opts}, Options[ListPlot]], 
   PlotRangePadding -> {{gap, gap}/2, {Automatic, Automatic}}, 
   FrameTicksStyle -> {{Automatic, Automatic}, {Automatic, FontColor -> Black}}, 
   FrameTicks -> {{Automatic, All}, {Transpose[{xcoords, levels}], 
      Transpose[{Mean /@ TakeList[xcoords, Length /@ data], labels}]}}, 
   PlotMarkers -> {Graphics[{Disk[]}], .05}, 
   Joined -> True]]

Examples:

data = {Bucket, Nozzle, NzD};

labels = Style[#, 16] & /@ {"Bucket", "Nozzle", "NzD"};

mainEffectsPlot[data, labels, 
 ImageSize -> Large, 
 FrameLabel -> {None, Style["Mean of means", 16]}, 
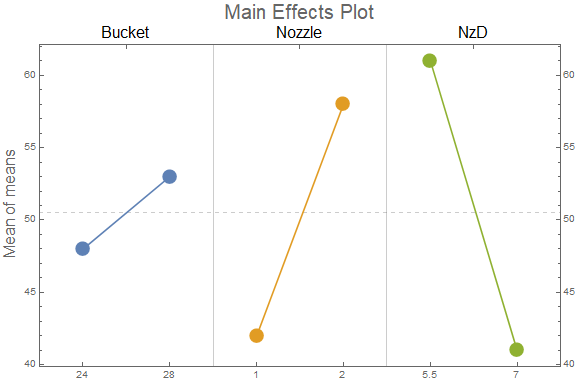
 PlotLabel -> Style[ "Main Effects Plot", 20]]

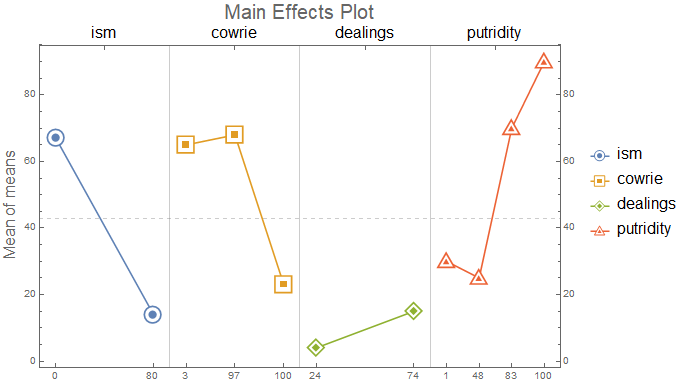
enter image description here

SeedRandom[1]
data2 = SortBy[First] @ RandomInteger[100, {#, 2}] & /@ {2, 3, 2, 4};
labels2 = Style[#, 16] & /@ RandomWord["Noun", 4];

mainEffectsPlot[data2, labels2, 
 ImageSize -> Large, 
 FrameLabel -> {None, Style["Mean of means", 16]}, 
 PlotLabel -> Style[ "Main Effects Plot", 20],
 PlotMarkers -> Thread[{ChartElementData["CenterMarkers"][[All, 1]], .06}],
 PlotLegends -> LineLegend[labels2, BaseStyle -> EdgeForm[]]]

enter image description here

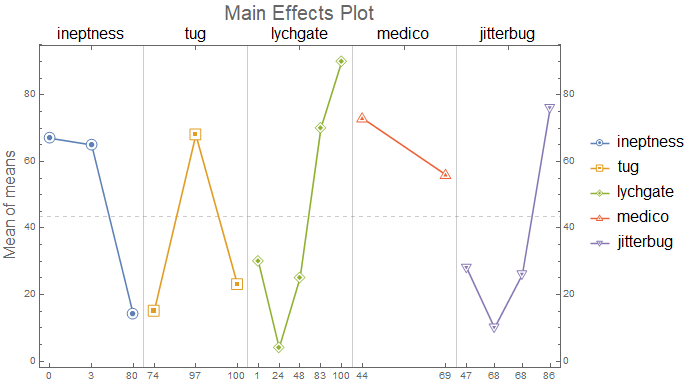
SeedRandom[1]
data3 = SortBy[First]@RandomInteger[100, {#, 2}] & /@ {3, 3, 5, 2, 4};
labels3 = Style[#, 16] & /@ RandomWord["Noun", 5];

mainEffectsPlot[data3, labels3, 
 ImageSize -> Large, 
 FrameLabel -> {None, Style["Mean of means", 16]}, 
 PlotLabel -> Style["Main Effects Plot", 20], 
 PlotMarkers -> Thread[{ChartElementData["CenterMarkers"][[All, 1]], .04}], 
 PlotLegends -> LineLegend[labels3, BaseStyle -> EdgeForm[]]]

enter image description here

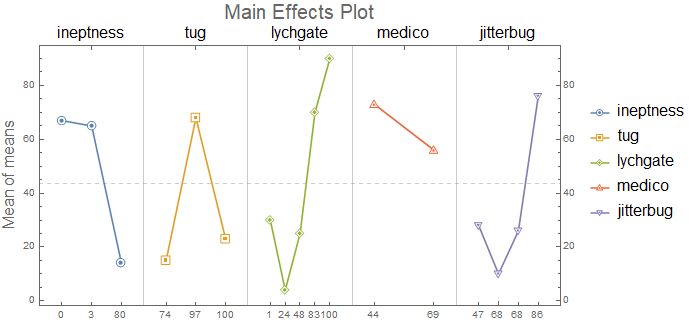
Add the options Spacings -> 3 and AspectRatio -> 1/2 to get

enter image description here

$\endgroup$
1
$\begingroup$

Using RectangleChart with a custom ChartElementFunction:

ClearAll[mainEffectsChart, cEF, preProcess]

cEF = {AbsolutePointSize[10], Point[{Mean @ #[[1]], #[[2, 2]]}], GrayLevel[.4],
    Text[Style[#3[[1, 1]], 11], Offset[{0, -5}, {Mean[#[[1]]], #3[[1, 2]]}], {0, 1}], 
    Line[Table[ Offset[{0, i}, {Mean[#[[1]]], #3[[1, 2]]}], {i, 0, 7}]]} &;

preProcess = Module[{min = Min@# - .1 Abs[Subtract@@#] & @ MinMax[#[[All, All, -1]]]},
    Module[{ll = Length @ #}, Rule[{1/ll, #2}, {#, min}] & @@@ #] & /@ #] &;

mainEffectsChart = Module[{data = preProcess @ #,
     colors = ColorData[97] /@ Range[Length @ #],
     labels = #2,
     means = #[[All, All, -1]],
     gl = 3/2 Range[Length@# - 1], 
     yrange = (# + {-.1, .1} Abs[Subtract @@ #]) & @ MinMax @ #[[All, All, -1]]},
   ReplaceAll[l_Line :> {Thick, Last[colors = RotateLeft[colors]], l}]@
     RectangleChart[data,
      Joined -> {{Mean@#[[1]], #[[2, 2]]} &}, 
      Frame -> True, 
      ChartStyle -> {colors, None},
      GridLines -> {gl, {{Mean@Flatten@means, Dashed}}},
      BarSpacing -> {0, .5}, 
      PlotRange -> {{0, 3/2 Length@data}, yrange},
      ImagePadding -> {{Automatic, Automatic}, {Scaled[.05], Automatic}},
      PlotRangePadding -> 0,
      FrameTicks -> {{Automatic, All},
        {Automatic, Thread[{3/4 + Prepend[gl, 0], labels, 0}]}},
      ChartElementFunction -> cEF, ##3]] &;

Examples:

data = {Bucket, Nozzle, NzD};

labels = Style[#, 16] & /@ {"Bucket", "Nozzle", "NzD"};

mainEffectsChart[data, labels, ImageSize -> Large, 
 FrameLabel -> {None, Style["Mean of means", 16]}, 
 PlotLabel -> Style["Main Effects Plot", 20]]
enter image description here

SeedRandom[1]
data3 = SortBy[First]@RandomInteger[100, {#, 2}] & /@ {3, 3, 5, 2, 4};
labels3 = Style[#, 16] & /@ RandomWord["Noun", 5];

mainEffectsChart[data3, labels3, ImageSize -> Large, 
 FrameLabel -> {None, Style["Mean of means", 16]}, 
 PlotLabel -> Style["Main Effects Plot", 20], 
 ChartLegends -> LineLegend[labels3, LegendMarkers -> {"●", 12}]]
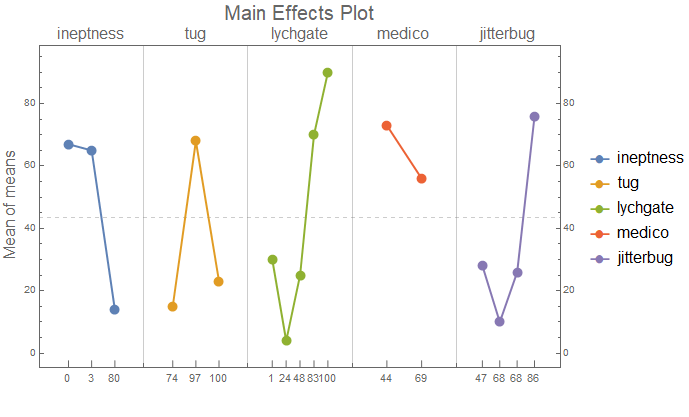
enter image description here

$\endgroup$
2
  • $\begingroup$ Excellent solution. But unfortunately my knowledge of Mathematica is far below yours. What should I change to have only one color for the lines (ex: black) and a color for the points (ex: blue) in all graphics? Also, how do I reduce the PlotRangePad to leave a smaller space between the points and the frame of each graph, without reducing their width? And, where do I change the width of the graphics and the frame as a whole? Thanks in advance. $\endgroup$ Commented Mar 18, 2021 at 19:32
  • $\begingroup$ @ALEXANDREARARIPE, replace colors = ColorData[97] /@ Range[Length @ #] with colors = Table[Blue, Length@#] to have all points blue, and replace Last[colors = RotateLeft[colors]] with Black to make all lines black. Adjusting the spacings is more involved; I will post an update if I find an easy way to make it a user-specified parameter. $\endgroup$
    – kglr
    Commented Mar 18, 2021 at 20:03

Your Answer

By clicking “Post Your Answer”, you agree to our terms of service and acknowledge you have read our privacy policy.

Not the answer you're looking for? Browse other questions tagged or ask your own question.