5
$\begingroup$

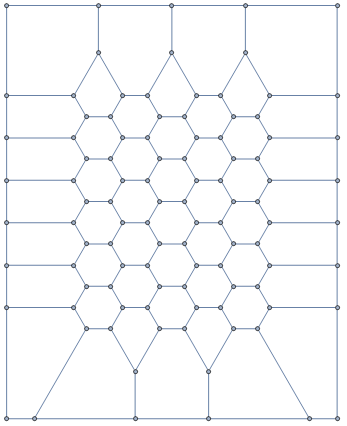
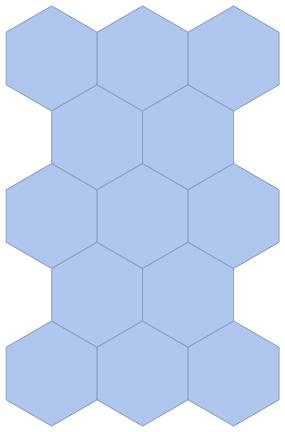
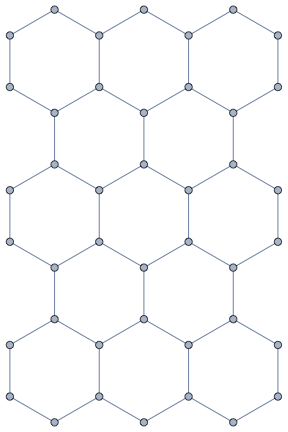
I want to draw the following graph

enter image description here

using VoronoiMesh. For example, since

L = 3;
pts = Flatten[
   Table[{3/2 i, Sqrt[3] j + Mod[i, 2] Sqrt[3]/2}, {i, L + 4}, {j, 
     L + 4}], 1];
mesh0 = VoronoiMesh[pts];
gr = Graph[mesh0["Edges"], 
  VertexCoordinates -> MeshCoordinates[mesh0]]

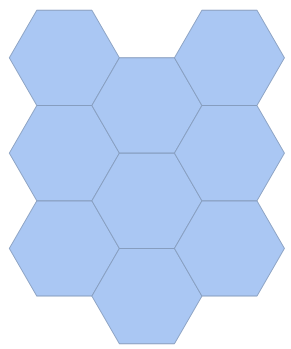
yields

enter image description here

I thought about "trimming" the Voronoi mesh in the following manner (see this question for more info)

mesh1 = MeshRegion[MeshCoordinates[mesh0], 
   With[{a = PropertyValue[{mesh0, 2}, MeshCellMeasure]}, 
    With[{m = 3}, Pick[MeshCells[mesh0, 2], UnitStep[a - m], 0]]]];
mesh = MeshRegion[MeshCoordinates[mesh1], MeshCells[mesh1, {2, "Interior"}]]

enter image description here

However, when using either mesh["Edges"] or mesh["Coordinates"] for this mesh, I get the following error

enter image description here

Any idea why?

Regarding the mesh coordinates, I can solve it using MeshCoordinates[mesh] instead. However, I cannot get the connectivity needed to build the graph. Somehow, MeshRegion used in this way seems to lose (or change) some of its properties. I've also tried, using something like (from this question)

gvoronoi = 
 AdjacencyGraph[mesh["AdjacencyMatrix"], 
  VertexCoordinates -> MeshCoordinates[mesh]]

but with no success. Any ideas?

Additionally, if you have any better suggestions regarding building a graph like this, for any L, please feel free to share!

$\endgroup$
3
  • 1
    $\begingroup$ Clearly this is not a case where you can use the undocumented functionality. Thus, Graph[UndirectedEdge @@@ MeshCells[mesh, 1][[All, 1]], VertexCoordinates -> MapIndexed[First[#2] -> #1 &, MeshCoordinates[mesh]]]. $\endgroup$ Commented Feb 4, 2020 at 12:02
  • 1
    $\begingroup$ As I remember you said that you only want to use built-in functions so that they can be used with the Wolfram Player. I posted an answer with IGraph/M as it may be useful for future visitors as well. $\endgroup$
    – Szabolcs
    Commented Feb 4, 2020 at 15:26
  • $\begingroup$ Yes, that is correct. Thank you anyway, I'll probably start using IGraph/M for future WolframPlayer-independent projects. Seems @J.M.isinlimbo's comment does the trick without it. $\endgroup$
    – sam wolfe
    Commented Feb 4, 2020 at 16:04

2 Answers 2

5
$\begingroup$
L = 3;
pts = Flatten[Table[{3/2 i, Sqrt[3] j + Mod[i, 2] Sqrt[3]/2}, {i, L + 4}, {j, L + 4}], 1];

mesh0 = VoronoiMesh[pts];
mr0 = DiscretizeGraphics[Select[MeshPrimitives[mesh0, 2], 
    RegionWithin[Rectangle @@ Transpose[CoordinateBounds[pts]], #] &]];

el0 = MeshCells[mr0, 1] /. Line -> Apply[UndirectedEdge];
vc0 = MeshCoordinates[mr0];

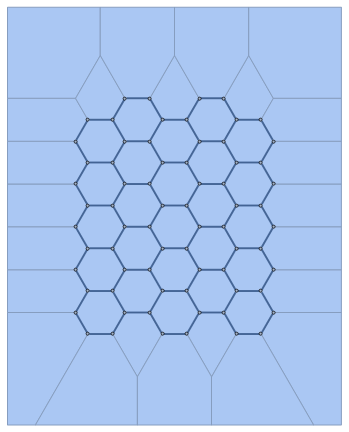
Show[mesh0, Graph[el0, VertexCoordinates -> vc0, EdgeStyle -> Thick]]

enter image description here

Slightly more convenient approach is to provide the coordinate bounds in the second argument of VoronoiMesh and discretize the interior polygons:

mesh1 = VoronoiMesh[pts, CoordinateBounds[pts]];

mr1 = DiscretizeGraphics[MeshPrimitives[mesh1, {2, "Interior"}]];

el1 = MeshCells[mr1, 1] /. Line -> Apply[UndirectedEdge];
vc1 = MeshCoordinates[mr1];

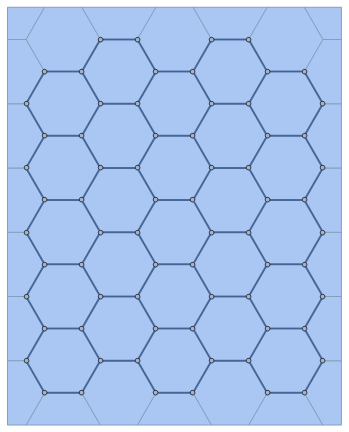
Show[mesh1, 
 Graph[el1, VertexCoordinates -> vc1, EdgeStyle -> Thick]]

enter image description here

$\endgroup$
6
$\begingroup$

With IGraph/M, you can use

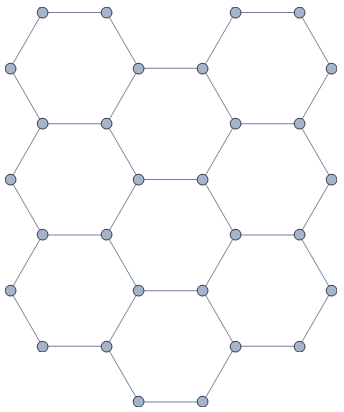
IGLatticeMesh["Hexagonal", Rectangle[{0, 0}, {2, 4}]]

enter image description here

IGLatticeMesh first fills the region Rectangle[{0, 0}, {2, 4}] with lattice points, then places a unit mesh cell at each lattice point. You can use a different region to obtain a different overall shape. Keep in mind that it is not the mesh that is being cropped to this region, but only the points that define the locations of unit cells.

IGMeshGraph[%]

enter image description here

$\endgroup$

Your Answer

By clicking “Post Your Answer”, you agree to our terms of service and acknowledge you have read our privacy policy.

Not the answer you're looking for? Browse other questions tagged or ask your own question.