0
$\begingroup$

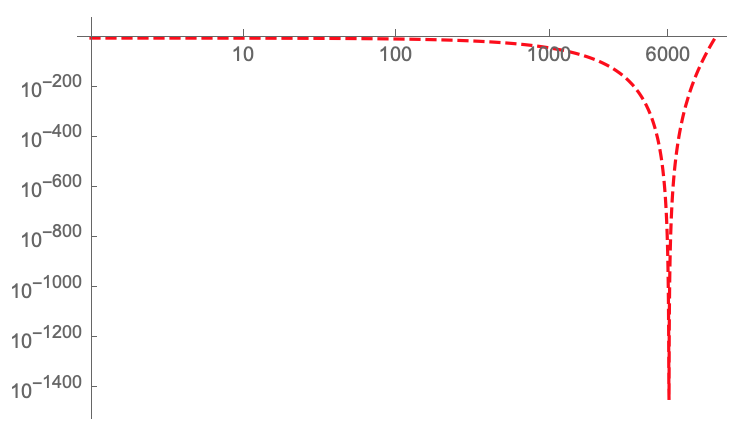
I'm trying to plot this function, but probably since the numbers are really small it shows a fake plot in log log scale. Is there a way to solve this problem?

LogLogPlot[499*(6000 - x)^498/6000^499, {x, 1, 9000}, 
 PlotRange -> {{1, 7000}, Automatic}, PlotStyle -> {Red, Dashed}, 
 Ticks -> {{10, 100, 1000, 6000}, Automatic}]

The hump near 6000 doesn't exist

$\endgroup$
6
  • 1
    $\begingroup$ Try: LogLogPlot[N@499*(6000 - x)^498/6000^499, {x, 1, 9000}, PlotRange -> {{1, 7000}, Automatic}, PlotStyle -> {Red, Dashed}, Ticks -> {{10, 100, 1000, 6000}, Automatic}] $\endgroup$
    – Fraccalo
    Commented Nov 28, 2019 at 17:24
  • $\begingroup$ For me it's the same $\endgroup$
    – davideor
    Commented Nov 28, 2019 at 17:30
  • 1
    $\begingroup$ You need to use PlotRange -> {{1, 7000}, All} to show the full range of values. To prevent it from showing any errors, you can use PlotRange->{{1, 7000}, {10^-1000, 1}} (otherwise, it tries to plot 0 at x=6000 which will obviously not work) $\endgroup$
    – Lukas Lang
    Commented Nov 28, 2019 at 17:47
  • $\begingroup$ Even with your solution it doesn't work.. probably it's not just the final number but the intermediate results. $\endgroup$
    – davideor
    Commented Nov 28, 2019 at 18:41
  • $\begingroup$ @davideor You'll have to be more specific than "does not work", for me, the following plot is produced with LogLogPlot[499*(6000 - x)^498/6000^499, {x, 1, 9000}, PlotRange -> {{1, 7000}, {10^-1000, 1}}, PlotStyle -> {Red, Dashed}, Ticks -> {{10, 100, 1000, 6000}, Automatic}]: Image $\endgroup$
    – Lukas Lang
    Commented Nov 28, 2019 at 19:22

1 Answer 1

3
$\begingroup$

It looks to me like the problem is that your plot simply doesn't go far enough. For a plot like that, I would go at least to 2 * your multiplier (6000), so I would go to 12000 at least on the x-axis.

I've also gone to smaller y-values to better visualize the dip.

LogLogPlot[
  499*(6000 - x)^498/6000^499, 
  {x, 1, 12000}, 
  PlotRange -> All, 
  PlotStyle -> {Red, Dashed}, 
  Ticks -> {
    {10, 100, 1000, 6000}, 
    Table[
      {10^i, Superscript["10", ToString[i]], {0.01, 0}}, 
      {i, -2000, 0, 200}
    ]
  }
]

LogLogPlot of poster's function with expanded x-scale.

$\endgroup$
4
  • $\begingroup$ I still have an output different from yours.. imgur.com/a/Z05znyt $\endgroup$
    – davideor
    Commented Nov 28, 2019 at 20:20
  • $\begingroup$ @davideor If you use the code I posted above in a fresh kernel, you should get the same output unless it's a weird version-dependent thing. Perhaps you have some kind of lingering definitions that are not the same as what the rest of us are using, because none of us seem to be able to replicate what you're seeing. Try starting from a fresh kernel and see if that helps. $\endgroup$
    – MassDefect
    Commented Nov 28, 2019 at 20:32
  • $\begingroup$ The fact that in our lab we are using Wolfram mathematica 10 could be relevant? $\endgroup$
    – davideor
    Commented Nov 29, 2019 at 0:17
  • $\begingroup$ @davideor Possibly? You might want to add your version details and OS to the post and see if anyone running the same version/OS can replicate it. I only have version 12 on macOS 10.15.1. Though I have to admit, I would be pretty surprised to find that MMA v10 behaved that differently on such a simple plot. $\endgroup$
    – MassDefect
    Commented Nov 29, 2019 at 2:56

Your Answer

By clicking “Post Your Answer”, you agree to our terms of service and acknowledge you have read our privacy policy.

Not the answer you're looking for? Browse other questions tagged or ask your own question.