0
$\begingroup$

I have 2 functions;

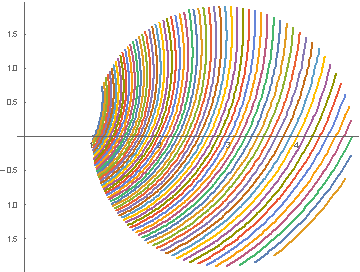
funtion 1:

ctr = {(Exp[Pi*0.5] + 1)/2, 0};
radius = (Exp[Pi*0.5] - 1)/2;
pp = PolarPlot[
  Evaluate@Table[Exp[(t + 2*Pi*i/120)*0.5], {i, 1, 120}], {t, -Pi, 
   Pi}, RegionFunction -> (Norm[{#, #2} - ctr] <= radius &)]
Total[ArcLength /@ Cases[pp, _Line, All]]

spiral

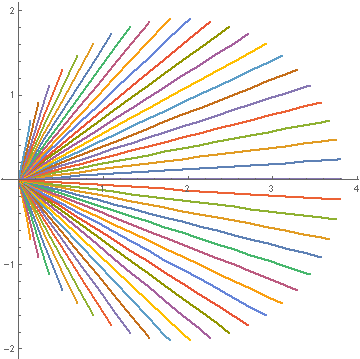
and function 2:

ctr = {(Exp[Pi*0.5] - 1)/2, 0};
radius = (Exp[Pi*0.5] - 1)/2;
pp2 = ParametricPlot[
  Evaluate[Table[{t, t (Tan[2 j Pi / 120])}, {j, 1, 60}]], {t, -5, 5},
   RegionFunction -> (Norm[{#, #2} - ctr] <= radius &), 
  PlotRange -> All]
Total[ArcLength /@ Cases[pp2, _Line, All]]

Line

I want to show that function 1 is distributed within the circle more homogeneously than function 2 as it is inferred by the graphs. It is clearly seen that function 1 is more homogeneous but I need to support it by the data. How can I show it in mathematica?

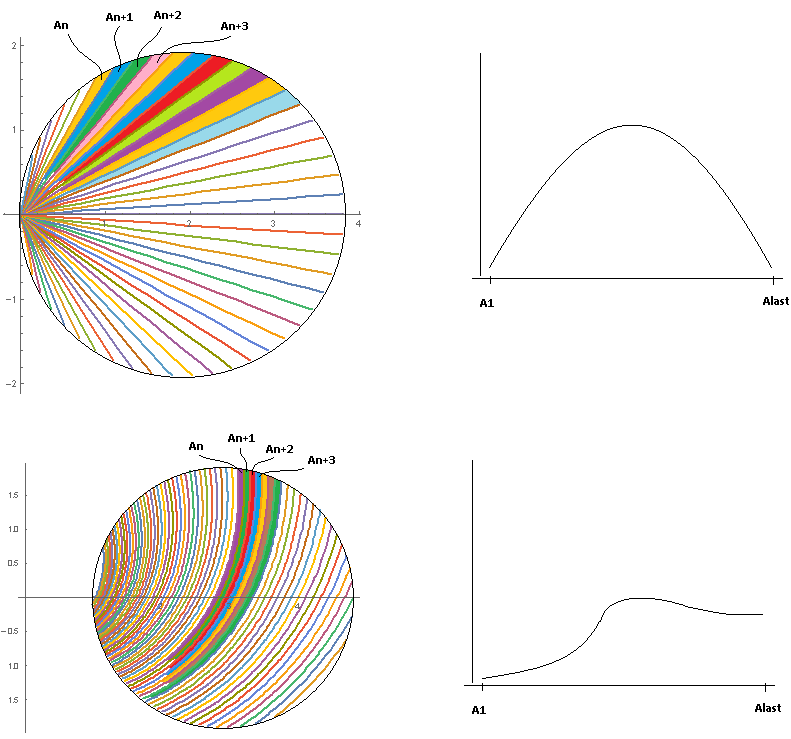
Maybe, the area between the lines in the intersection circle give me what I want as below:

gradient

I can show that the maximum missing spaces between the lines are less in function 1.

$\endgroup$
6
  • $\begingroup$ We need a definition of what you mean by homogeneous. Perhaps the gradient is constant or the gradient is approximately constant compared to...? $\endgroup$
    – Hugh
    Commented Feb 18, 2019 at 11:58
  • $\begingroup$ @Hugh Yes, actually change in the gradient is a good point to prove homogenity. I will edit the question. $\endgroup$
    – Alper91
    Commented Feb 18, 2019 at 12:00
  • $\begingroup$ @Hugh Do you think the areas between the lines may help me with my purpose? I edited the question. $\endgroup$
    – Alper91
    Commented Feb 19, 2019 at 7:18
  • $\begingroup$ Best would be to get an expression for the function within the region. Then take its gradient. Can you give the expression for the function? It is not clear to me why you are representing your function as a set of lines. $\endgroup$
    – Hugh
    Commented Feb 19, 2019 at 8:40
  • 1
    $\begingroup$ We need more clarity in what you are doing. What you call your first function seems to be a list of trajectories plotted within a circular region. This is not a function but a list of trajectories. A function would have the form f[r,theta] = ... $\endgroup$
    – Hugh
    Commented Feb 19, 2019 at 12:58

0

Your Answer

By clicking “Post Your Answer”, you agree to our terms of service and acknowledge you have read our privacy policy.

Browse other questions tagged or ask your own question.