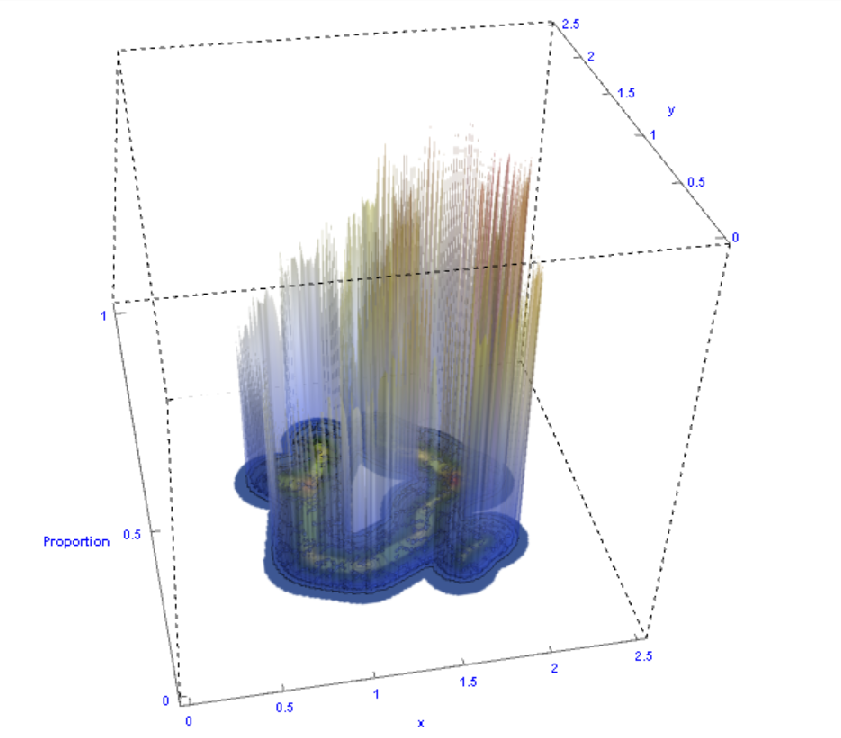
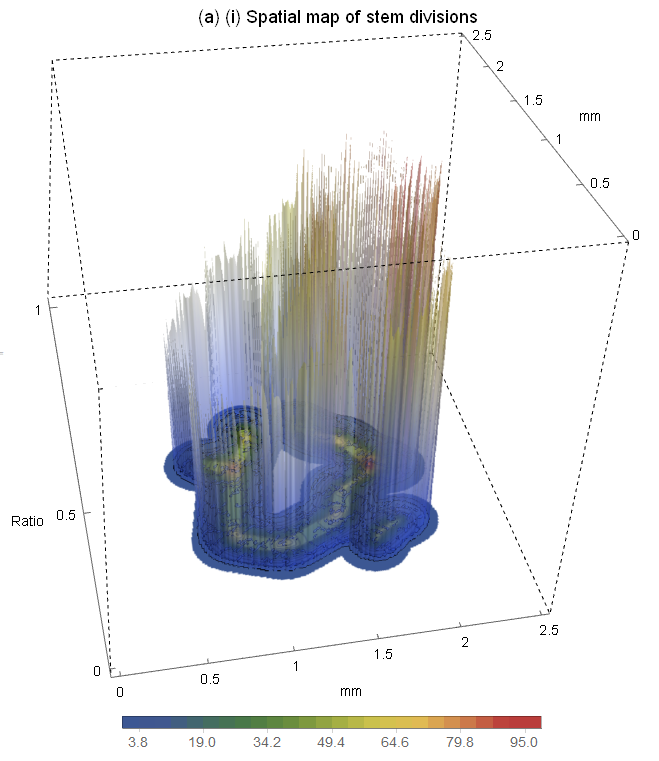
I have a rather complex looking plot which is a combination of graphics objects, generated by
data = Import["o2ld.csv"];
data2 = Import["stemld.csv"];

a1 = ListContourPlot[data, Contours -> 25, Axes -> False,
PlotRangePadding -> 0, Frame -> False,
ColorFunction -> "DarkRainbow", PlotRange -> {0.001, 100}];

a2 = ListPlot3D[data2, ClippingStyle -> None, Mesh -> None,
ColorFunction -> "TemperatureMap", PlotRange -> {0.001, 1},
PlotStyle -> Opacity[0.33]];

level = -0.01; gr =
Graphics3D[{Texture[a1], EdgeForm[],
 Polygon[{{0, 0, level}, {200, 0, level}, {200, 200, level},
{0, 200, level}},
 VertexTextureCoordinates -> {{0, 0}, {1, 0}, {1, 1}, {0,
 1}}]}, Lighting -> "Neutral"];

 out = Show[a2, gr, PlotRange -> All, BoxRatios -> {1, 1, 1},
 BoxStyle -> Directive[Dashed, Black, Thin],
 ViewPoint -> {-0.35, -2, 1.5},
 AxesLabel -> {"x", "y", "Proportion"},
 LabelStyle -> Directive[Blue, Bold],
 Ticks -> {{{0, 0}, {40, 0.5}, {80, 1}, {120, 1.5}, {160, 2},
 {200,  2.5}}, {{0, 0}, {40, 0.5}, {80, 1}, {120, 1.5}, {160,
 2}, {200,  2.5}}, {0, 0.5, 1}}, ImageSize -> Large]
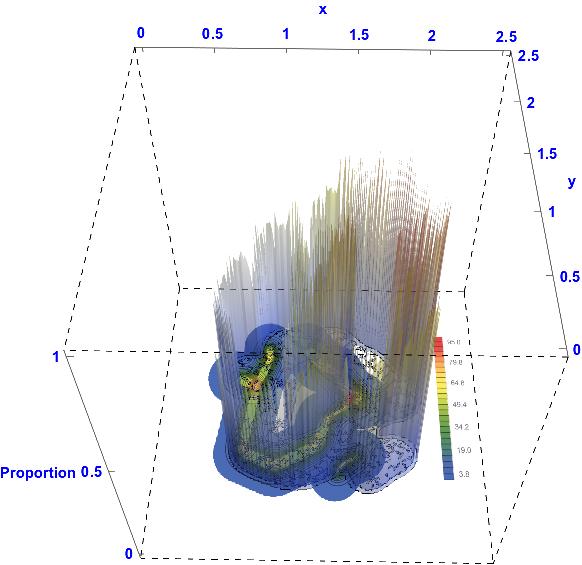
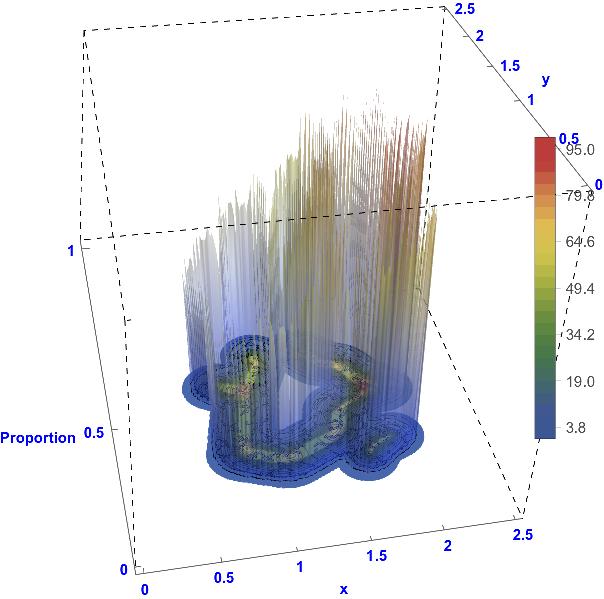
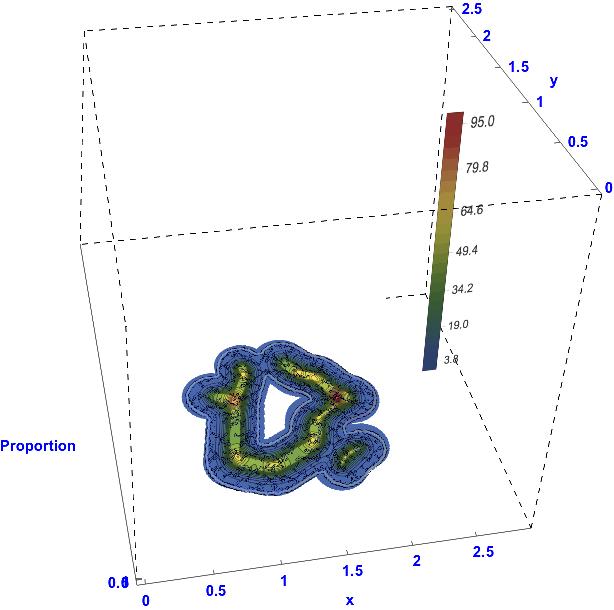
What I would like to do is add a bar legend to the right of the right, based on the values from data (a1). I can create the precise bar easily enough with
vr = BarLegend[{"DarkRainbow", {0, Max[data]}}, 25];
But as this is not a graphics object, I cannot get it to display in with Show. Nor can I seem to get it working with epilog or inset. Does anyone have any idea how to include the bar to the right? I can included csv files for ease of recreation if required, downloadable in a RAR here.

GraphicsRow? $\endgroup$Legended[]? $\endgroup$