This is one of those "I'm not even sure how to ask this" kind of questions. You could be asking any (or all) of the following three questions.
How do I add a legend to appear on a ListContourPlot?
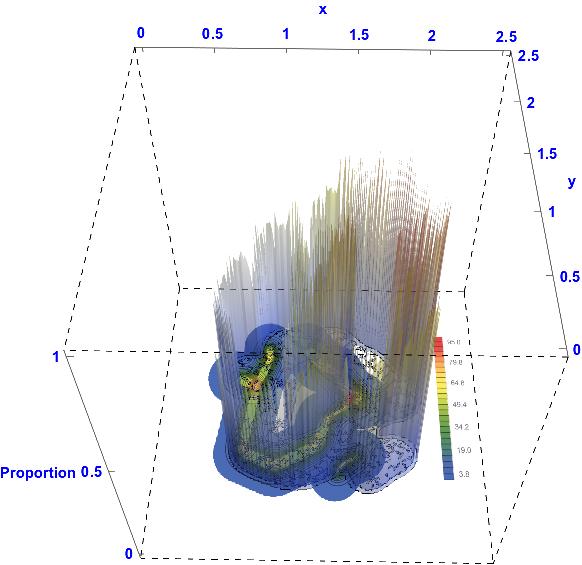
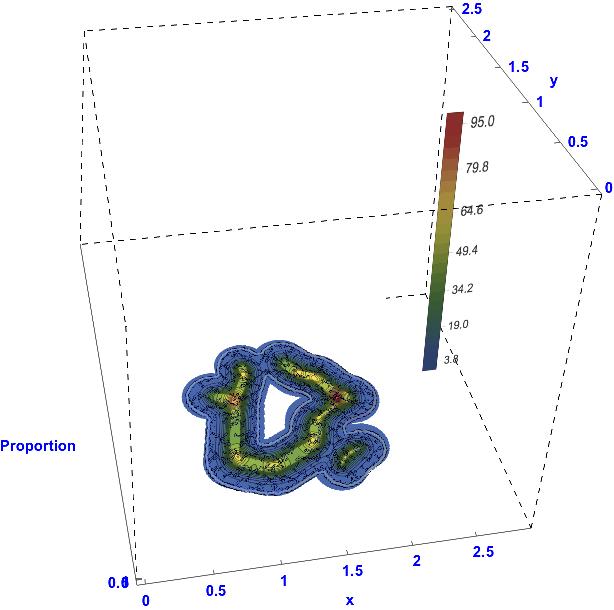
All you need to do is add PlotLegends->Automatic to your ListContourPlot:
a1=ListContourPlot[data, Contours->25,Axes->False,
  PlotRangePadding->0, Frame->False,ColorFunction->"DarkRainbow",
  PlotRange->{0.001,100}, PlotLegends->Automatic];

The legend will be drawn on the same 3D surface as its associated plot.
How do I make a BarLegend object into a Graphics object?
It already is a Graphics object in StandardForm. From the docs:
BarLegend is displayed in StandardForm as a graphics object.
How do I place a Graphics object in the Epilog of a Graphics3D object?
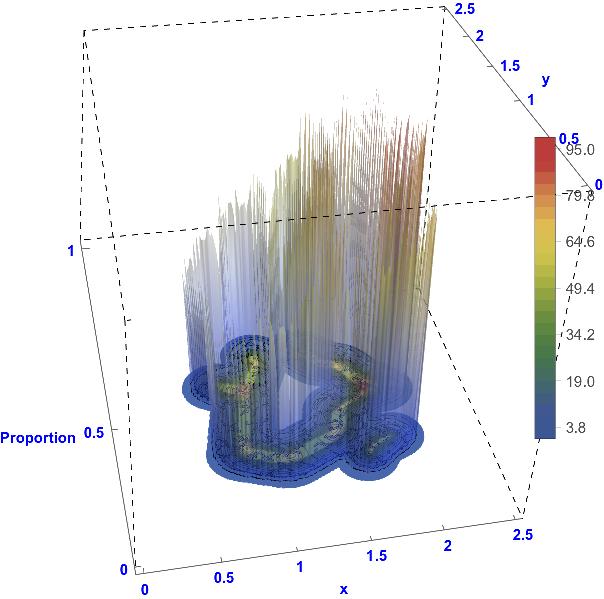
Use Epilog with Inset to position the object.
vr = BarLegend[{"DarkRainbow", {0, Max[data]}}, 25];
out = Show[a2, gr, PlotRange -> All, BoxRatios -> {1, 1, 1},
BoxStyle -> Directive[Dashed, Black, Thin],
ViewPoint -> {-0.35, -2, 1.5},
AxesLabel -> {"x", "y", "Proportion"},
LabelStyle -> Directive[Blue, Bold],
Ticks -> {{{0, 0}, {40, 0.5}, {80, 1}, {120, 1.5}, {160, 2},
{200,  2.5}}, {{0, 0}, {40, 0.5}, {80, 1}, {120, 1.5}, {160,
2}, {200,  2.5}}, {0, 0.5, 1}}, ImageSize -> Large,
Epilog -> Inset[vr, {Right, Center}, {Right, Center}]]

The object will sit in front of the 3D object and will not move as the 3D object is rotated.
How do I place a Graphics object wherever I want in the scene of a Graphics3D object?
It should be the same as you did with the ListContourPlot a1, but the ListPlot3D a2 disappears every time I try it. Must be a bug.
vr = BarLegend[{"DarkRainbow", {0, Max[data]}}, 25];
legendLeft = 190; legendWidth = 40;
legendHeight = 200; legendDepth = 100;
legend3D =
  Graphics3D[{EdgeForm[], {Texture[
      Rasterize[vr, Background -> None, ImageResolution -> 200]],
     Polygon[{{legendLeft, legendDepth, 0}, {legendLeft + legendWidth,
         legendDepth, 0}, {legendLeft + legendWidth, legendDepth,
        legendHeight}, {legendLeft, legendDepth, legendHeight}},
      VertexTextureCoordinates -> {{0, 0}, {1, 0}, {1, 1}, {0, 1}}]}}];

out = Show[a2, gr, legend3D, PlotRange -> All, BoxRatios -> {1, 1, 1},
   BoxStyle -> Directive[Dashed, Black, Thin],
  ViewPoint -> {-0.35, -2, 1.5},
  AxesLabel -> {"x", "y", "Proportion"},
  LabelStyle -> Directive[Blue, Bold],
  Ticks -> {{{0, 0}, {40, 0.5}, {80, 1}, {120, 1.5}, {160, 2}, {200,
  2.5}}, {{0, 0}, {40, 0.5}, {80, 1}, {120, 1.5}, {160, 2}, {200,
  2.5}}, {0, 0.5, 1}}, ImageSize -> Large]


