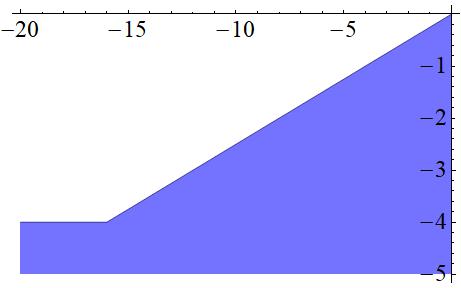
I have shown some plots by using Show and Plot together. The problem is that an extra blue line is created in the output which I can not remove it. This is my code:
v = 2;
tr = -2;
ro = 2;
both = Plot[{v x/(-4 tr)}, {x, -20, 0}, AxesOrigin -> {0, 0}, Filling -> ro tr - 1, FillingStyle -> {Directive[Opacity[0.55], Blue]}, GridLines -> {None, {0.5}}];
bothh = Plot[{v x/(-4 tr)}, {x, -20, -16}, AxesOrigin -> {0, 0}, Filling -> ro tr, FillingStyle -> {Directive[Opacity[0.55], Blue]},GridLines -> {None, {0.5}}];
Show[both, bothh, PlotRange -> All, Axes -> True,LabelStyle -> Directive[Large, Black]]
Could anyone help me?
*By extra line I mean the line which is created between two regions


PlotStyle -> Noneinbothandbothh? $\endgroup$Show[both, bothh, PlotRange -> All, Axes -> True, LabelStyle -> Directive[Large, Black]] /. Line[x_] :> Sequence[]$\endgroup$