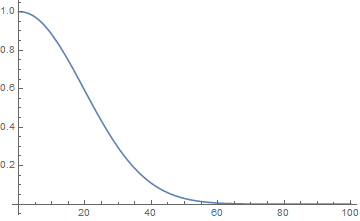
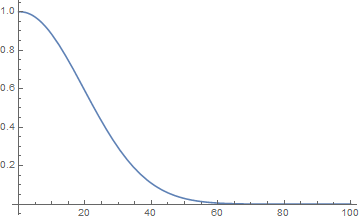
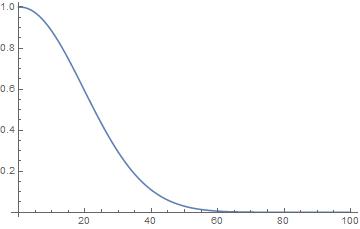
I'm trying to plot a probability function that has large fractions between 0 and 1, but Plot returns an empty graph.
The strange thing is that when I adjust the sampling using the output slider or adjust the line thickness, I can briefly see the graph before it goes away once I let go.
I'm currently on version 11.0.
Here's my code:
func[x_] := 365!/((365 - x)! 365^x)
Plot[func[x], {x, 0, 100}]
I've also tried defining func[x_] as N[...] (calculating the numerical value), but that makes no difference.


ListLinePlot[Table[{x, func[x]}, {x, 100}]]$\endgroup$