4
$\begingroup$

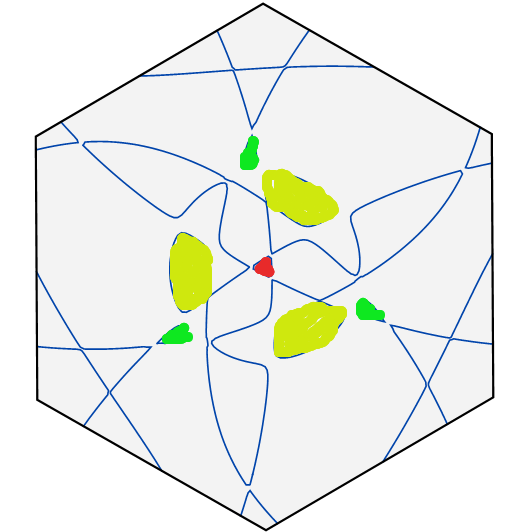
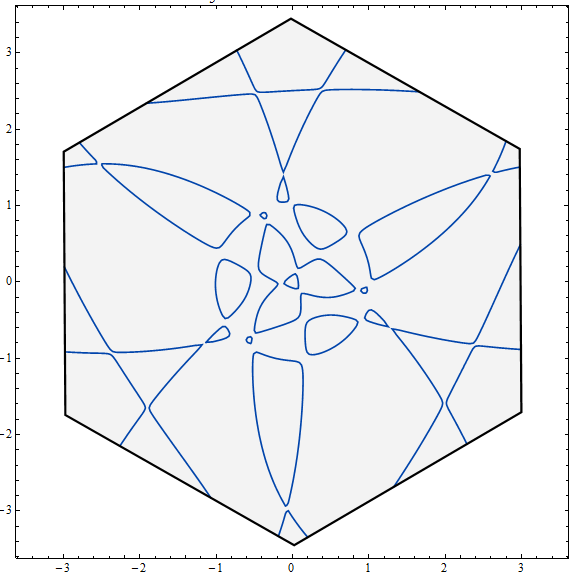
Is there a way to simply compute the area enclosed by a line in an image, like this:

enter image description here

Here's an example of what I mean by a few of the "enclosed regions"

enter image description here

Solution 1

These sorts of images are produced on my end by a ListContourPlot of some functions, so in principle I have a mesh of domain points and associated function values. However, importantly, this doesn't give me exactly the points show in these contours, which are found by ListContourPlot. In principle, I suppose I could construct some method for manually finding all these points and using Green's Theorem to construct a numerical approximation of the areas. This would be a ton of work.

Solution 2

I feel like there should surely be an easier way to find these areas in post-processing/image processing. The lines are all a single, known, hue, as is the background between. I don't know where to start on this method, but hopefully you can help!

$\endgroup$
4
  • 5
    $\begingroup$ Would you mind including the code that generated the contour plot so people can base their answers on it? $\endgroup$ Commented Apr 18, 2016 at 15:18
  • $\begingroup$ The code that generated those images is long and obfuscated, but it is based on the solution to a previous question of mine, here, so feel free to solve this problem based on that as well. mathematica.stackexchange.com/questions/111871/… $\endgroup$
    – Steve
    Commented Apr 18, 2016 at 15:38
  • $\begingroup$ @Steve - the contours that MarcoB is using to work out this below have many fully closed regions, whereas your plot has many almost closed regions. Are you interested in being able to select a portion of the image and have that whatever closed region that is part of? $\endgroup$
    – Jason B.
    Commented Apr 19, 2016 at 6:59
  • $\begingroup$ Also, I have an easy way for you to give us the code for your plot. Run all the commands that generate the plot, then after it has been generated type CopyToClipboard@InputForm@Normal@%, then go to gist.github.com and paste the result there, and link the result here. It would be something like this $\endgroup$
    – Jason B.
    Commented Apr 19, 2016 at 7:06

1 Answer 1

4
$\begingroup$

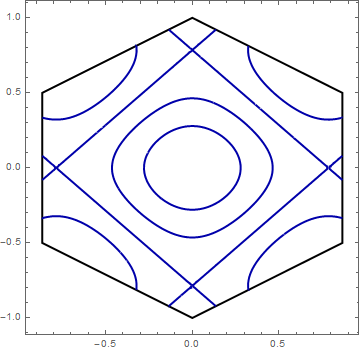
Here's a quick attempt using morphological image analysis on my own contour plot, since you did not provide yours:

  1. Generate a contour plot with some closed contours and style it more or less like yours:

    contour = ContourPlot[
      Sin[2 x]^2 - Cos[2 y]^2, {x, y} ∈ Polygon[CirclePoints[{1, 90 Degree}, 6]],
      PlotPoints -> 75, Contours -> 4,
      ContourShading -> None, ContourStyle -> Directive[Thick, Darker@Blue],
      BoundaryStyle -> {Thick, Black},
      PlotRangePadding -> Scaled[.05]
    ]
    

contour plot

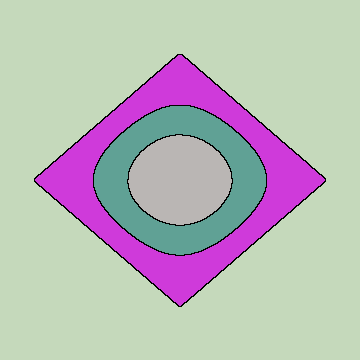
  1. Calculate the morphological components of the image (I pre-emptively remove the frame of the graph to avoid confusion):

    components = WatershedComponents[Show[contour, Frame -> False]]
    Colorize[components]
    

watershed components

  1. Measure the area of the identified components:

    ComponentMeasurements[components, "Area"]
    
    (* Out: {1 -> 91741.8, 2 -> 17916.5, 3 -> 11013.3, 4 -> 7016.} *)
    

In case you don't have CirclePoints in your version, replace it in the code above with:

{
  {0, 1}, {-(Sqrt[3]/2), 1/2}, 
  {-(Sqrt[3]/2), -(1/2)}, {0, -1}, 
  {Sqrt[3]/2, -(1/2)}, {Sqrt[3]/2, 1/2}
}
$\endgroup$
9
  • $\begingroup$ What are you saving as variable "contour"? $\endgroup$
    – Steve
    Commented Apr 18, 2016 at 15:55
  • $\begingroup$ @Steve The ContourPlot itself. Sorry, I lost that in copy / paste, but I added it back in now. $\endgroup$
    – MarcoB
    Commented Apr 18, 2016 at 15:56
  • $\begingroup$ Hmm. So I can't directly test your solution in version 9.0 because of CirclePoints, and so far my attempts at applying your solution directly to my image have been unsuccessful. $\endgroup$
    – Steve
    Commented Apr 18, 2016 at 16:00
  • $\begingroup$ @Steve I added the output of my CirclePoints expression, so you can test it on v.9. Also, I wanted to try this method out on your contours, put I couldn't immediately find where that contour plot you show was generated in the question you linked. Could you expand on that in your question? $\endgroup$
    – MarcoB
    Commented Apr 18, 2016 at 16:05
  • $\begingroup$ Yes, I'll expand on that. Also, this is what it's doing for me on the other contours: i.imgur.com/OrCQaG7.png $\endgroup$
    – Steve
    Commented Apr 18, 2016 at 16:07

Your Answer

By clicking “Post Your Answer”, you agree to our terms of service and acknowledge you have read our privacy policy.

Not the answer you're looking for? Browse other questions tagged or ask your own question.