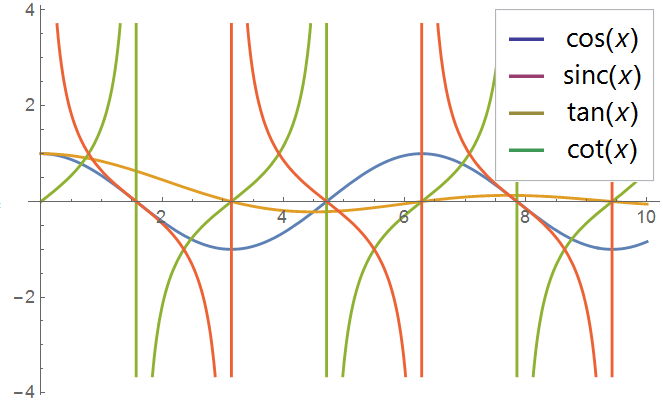
I am using the below code to create legends but I don't know why the colors in legends for various plots are different of devoted to main color of plots
From http://reference.wolfram.com/language/ref/Inset.html?q=Inset in Application part:
legendPlot[xl_List, d_, args___] :=
 Plot[xl, d,
 Epilog ->
 Inset[Panel[
 Grid[MapIndexed[{Graphics[{ColorData[1, First@#2], Thick,
       Line[{{0, 0}, {1, 0}}]}, AspectRatio -> .5,
      ImageSize -> 20], #1} &, xl]]],
  Offset[{-2, -2}, Scaled[{1, 1}]], {Right, Top}], args]
 legendPlot[{Cos[x], Sinc[x], Tan[x], Cot[x]}, {x, 0, 10}]
Sinc is Orange in the main plot Tan is Green, Cot is Red!!!!


legendPlotis using older version for colors. The first workaround would be defining a new color code and using that color code at both plots. $\endgroup$