2
$\begingroup$
  1. How can I find the best fitted 2-parameter Weibull's distribution (PDF) to describe my data? How can i plot my data and estimated distribution all in one graph?

  2. How can I show/compare results of different methods of finding both weibull's parameters (maximum likelihood, linear regression...)?

  3. completely optional; are there other interesting statistical informations concerning my problem that i should ask about here but I didn't due to my lack of experience with data analysis? any recommendations are very welcome and helpfull...


data = {{18.12, 0.}, {18.36, 0.}, {18.6, 0.00749}, {18.84, 0.00749}, {19.08, 
  0.}, {19.32, 0.00749}, {19.56, 0.03747}, {19.8, 0.02248}, {20.04, 
  0.02248}, {20.28, 0.08243}, {20.52, 0.05246}, {20.76, 
  0.02998}, {21., 0.08993}, {21.24, 0.09742}, {21.48, 
  0.06745}, {21.72, 0.16487}, {21.96, 0.13489}, {22.2, 
  0.27728}, {22.44, 0.13489}, {22.68, 0.16487}, {22.92, 
  0.31475}, {23.16, 0.14988}, {23.4, 0.32224}, {23.64, 
  0.2473}, {23.88, 0.22482}, {24.12, 0.26978}, {24.36, 
  0.20983}, {24.6, 0.23981}, {24.84, 0.14239}, {25.08, 
  0.13489}, {25.32, 0.07494}, {25.56, 0.06745}, {25.8, 
  0.04496}, {26.04, 0.07494}, {26.28, 0.08243}, {26.52, 
  0.02998}, {26.76, 0.02248}, {27., 0.01499}, {27.24, 
  0.02248}, {27.48, 0.02998}, {27.72, 0.02248}, {27.96, 
  0.00749}, {28.2, 0.}, {28.44, 0.}, {28.68, 0.}, {28.92, 
  0.00749}, {29.16, 0.00749}, {29.4, 0.}, {29.64, 0.}, {29.88, 0.}}
$\endgroup$
6
  • 2
    $\begingroup$ Look up FindDistributionParameters[]. $\endgroup$ Commented Jul 14, 2015 at 10:11
  • $\begingroup$ tried that. i get that one or more data points are not in support of weibull distr... :-( $\endgroup$
    – gd1980
    Commented Jul 14, 2015 at 10:15
  • $\begingroup$ Related: 63074, 61424 $\endgroup$
    – dionys
    Commented Jul 14, 2015 at 10:16
  • 1
    $\begingroup$ Should've mentioned that to begin with… it didn't work even with a good guess? $\endgroup$ Commented Jul 14, 2015 at 10:21
  • 1
    $\begingroup$ Cross Validated is a better SE site for your general stats questions. $\endgroup$ Commented Jul 14, 2015 at 13:36

4 Answers 4

8
$\begingroup$

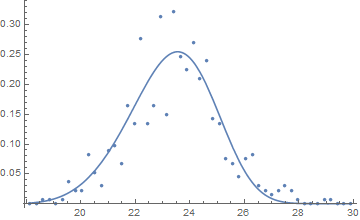
Your problem is that you are not fitting raw data to a distribution, you are fitting the emperical PDF of that distribution (probably in terms of values, percentages pairs). That won't work as the functions you are using (I guess EstimatedDistributionor FindDistributionParameters) expect the raw measurement data, not frequencies.

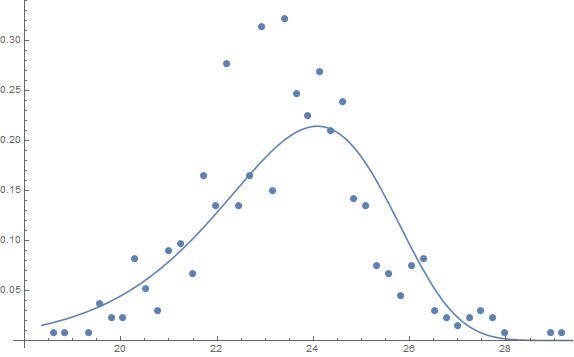
To deal with your specific data you need either FindFit or NonlinearModelFit and fit that to the PDF of the Weibull distribution (and I don't think your data is OK for a two-parameter Weibull):

f[x_] = 
NonlinearModelFit[
   data, 
   {PDF[WeibullDistribution[α, β, μ], x], α > 0 && β > 0}, 
   {α, β, μ}, x
]["BestFit"];

Show[
 ListPlot[data],
 Plot[f[x], {x, Min[data[[All, 1]]], Max[data[[All, 1]]]}]
 ]

enter image description here

$\endgroup$
6
$\begingroup$

This is a perfect place to use WeightedData.

dist = EstimatedDistribution[WeightedData @@ Transpose[data], WeibullDistribution[a, b]]

Show[ListPlot[data], Plot[PDF[dist, x], {x, 0, 30}]]

enter image description here

It is worth noting that observations with zero weights are ignored because they do not contribute to the likelihood.

$\endgroup$
2
  • $\begingroup$ @Andy I believe what Karsten means here is that in my FindFit all numbers are treated equally, although there is more data in the higher frequencies. I guess that's true, but I suppose that the difference in modelling assumptions/methods between NonLinearModelFit and EstimatedDistribution plays a role too. $\endgroup$ Commented Jul 14, 2015 at 23:16
  • $\begingroup$ @SjoerdC.deVries I've unintentionally made things too complicated by trying to point out that the zeros get ignored. I was hoping to not get into any more detail than that :) Removing all reference to NonlinearModelFit $\endgroup$
    – Andy Ross
    Commented Jul 14, 2015 at 23:21
4
$\begingroup$

As @Sjoerd C. de Vries states: one really wants to use the raw data. However, your data is binned with (I assume) the bin midpoints along with the associated relative frequency. And ideally you should account for the binning (although in this case it doesn't make much difference in the estimates and because as stated by others the fit is not hot anyway). If you had many fewer bins, then you would definitely need to account for the binning to get appropriate estimates.

To get the original integer frequencies divide by the smallest relative frequency - in this case it works because I'm sure you'll verify that the smallest positive frequency is 1 and corresponds to the relative frequency 0.07494. Further "proof" is that all of the other relative frequencies turn into numbers awfully close to integers.)

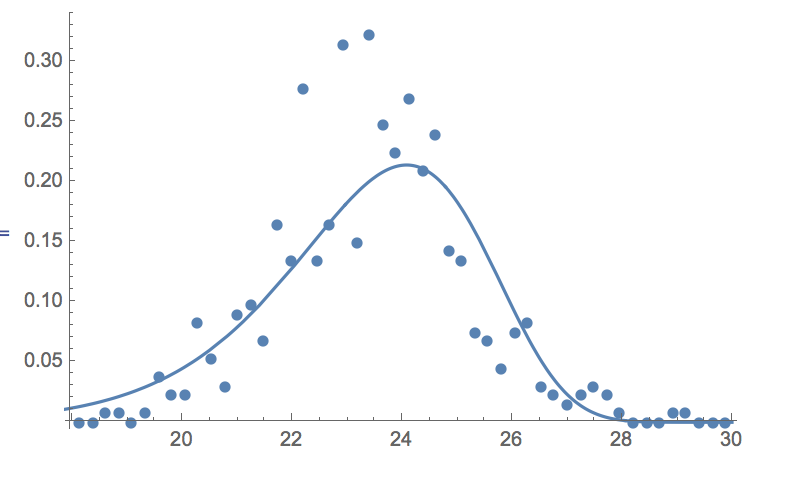
Here is the code to obtain the maximum likelihood estimates accounting for the binning of the data:

(* Bin mid-point and frequency *)
data = {{18.6, 1}, {18.84, 1}, {19.32, 1}, {19.56, 5}, {19.8, 
    3}, {20.04, 3}, {20.28, 11}, {20.52, 7}, {20.76, 4}, {21, 
    12}, {21.24, 13}, {21.48, 9}, {21.72, 22}, {21.96, 18}, {22.2, 
    37}, {22.44, 18}, {22.68, 22}, {22.92, 42}, {23.16, 20}, {23.4, 
    43}, {23.64, 33}, {23.88, 30}, {24.12, 36}, {24.36, 28}, {24.6, 
    32}, {24.84, 19}, {25.08, 18}, {25.32, 10}, {25.56, 9}, {25.8, 
    6}, {26.04, 10}, {26.28, 11}, {26.52, 4}, {26.76, 3}, {27, 
    2}, {27.24, 3}, {27.48, 4}, {27.72, 3}, {27.96, 1}, {28.92, 
    1}, {29.16, 1}};

(* Width of each bin *)
binWidth = 24/100;

(* Define log likelihood of binned data *)
logLikelihood[k_, lambda_] := Sum[data[[i, 2]] Log[
    Exp[-((data[[i, 1]] - binWidth/2)/lambda)^k] - 
     Exp[-((data[[i, 1]] + binWidth/2)/lambda)^k]],
  {i, Length[data[[All, 1]]]}]

(* Find maximum likelihood estimates *)
sol = FindMaximum[{logLikelihood[k, lambda], 
   k > 0 && lambda > 0}, {{k, 10}, {lambda, 24}}]

which results in

{-1910., {k -> 14.0869, lambda -> 24.205}}

A plot of the fit is given by

(* Plot results *)
p1 = Plot[(k/lambda) (x/lambda)^(k - 1) Exp[-(x/lambda)^k] /. 
    sol[[2]], {x, Min[data[[All, 1]]] - binWidth, 
    Max[data[[All, 1]]] + binWidth}];
n = Total[data[[All, 2]]];
p2 = ListPlot[
   Table[{data[[i, 1]], data[[i, 2]]/(n binWidth) }, {i, 
     Length[data[[All, 1]]]}], AxesOrigin -> {18, 0}];
Show[{p2, p1}]

Weibull fit

ADDITION: Estimates of variance and covariance can be obtained also (although good estimates of variance for a poor fit doesn't do one much good):

(* First partial derivatives *)
pLogL = D[logLikelihood[k, lambda], {{k, lambda}}];

(* Estimates of variances and the covariance of k and lambda *)
var = -Inverse[D[pLogL, {{k, lambda}}] /. sol[[2]]]
(* {{0.179681, 0.0108254}, {0.0108254, 0.00598091}} *)

(* Check to see that the first partial derivatives are close to zero *)
pLogL /. sol[[2]]
(* {2.13724*10^-7, -9.42956*10^-9} *)
$\endgroup$
8
  • $\begingroup$ The mean $x$-axis values within each bin do not occur at the mid point of each bin. One should do a survey of fit functions then test them. The problem as stated suggests approximately Poisson type counting data. This is not directly related to maximum likelihood. $\endgroup$
    – Carl
    Commented Jun 30, 2022 at 14:01
  • $\begingroup$ @Carl We will have to agree to disagree. Maximum likelihood does not assume that the mean of the raw values occurs at the midpoints of each bin. Only the regression approach does. And while the counts might be very well approximated by a Poisson, the counts are not available. Only the relative frequencies are available (unless the guess made by me to figure out what the counts are is correct). $\endgroup$
    – JimB
    Commented Jun 30, 2022 at 15:51
  • $\begingroup$ The guess you made is likely correct but I am not so sure it matters relatively speaking. That is, $\frac{(a0 x1)^{1/2}}{(a0 x2)^{1/2}}=\frac{x1^{1/2}}{x2^{1/2}}$ $\endgroup$
    – Carl
    Commented Jun 30, 2022 at 15:59
  • $\begingroup$ Regarding the midpoint, ML does not assume that. The assumption that is troubling is that bins can be used instead of original values and then perform ML with impunity. I also do not believe without proof that this is a two parameter Weibull, which is the more important question. $\endgroup$
    – Carl
    Commented Jun 30, 2022 at 16:10
  • $\begingroup$ @Carl It shouldn't be troubling. All ML assumes is that the form of the likelihood is correct (i.e., that one is sampling from a Weibull in this case) and that a count in the bin is known (as opposed to just knowing the relative frequency). There is no assumption either assumed or needed that the mean of the raw observations matches even closely to the midpoint of the bin. That is basic maximum likelihood. $\endgroup$
    – JimB
    Commented Jun 30, 2022 at 16:21
2
$\begingroup$

Let's first test which distribution is more likely. However, we should treat FindDistribution results with a grain of salt, it may be suggestive, but there are problems with the definition of AIC, which is not industry standard, e.g., see https://community.wolfram.com/groups/-/m/t/2198153 and prior links to it. Worse, this is the wrong routine to use for this data (mismatch), but I'm just mucking with the data to get ideas as to what might be worth testing.

FindDistribution[data[[All, 2]], 5, All]

enter image description here What I did was ignore the binning with the command data[[All, 2]], and doing that doesn't really harm anything other than shift the data by about 23 to the left. This suggests that perhaps a normal distribution may be good enough, and it would take a 3 parameter Weibull distribution to be competitive. Now this may be a three parameter Weibull distribution. In any case, treating it like a normal distribution one can do another thing that seems like heresy:

f1 = FindFit[data,c0 PDF[NormalDistribution[mu,sigma], x], {{c0, 1}, {mu, 23}, {sigma, 0.11}}, x]
Show[ListPlot[data, Filling -> Axis, FillingStyle -> Thickness[0.018],PlotStyle -> Directive[Blue, Opacity[.3]]], Plot[Evaluate[c0 PDF[NormalDistribution[mu, sigma], x] /. f1], {x, 18, 30}, PlotStyle -> Red]]
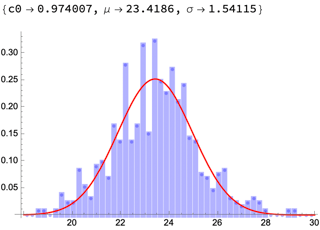
enter image description here

Which shows the data with its fit function. There is likely some skewness, so one could try a three parameter Weibull distribution. Given the magnitude of the $x$-values, without a location parameter, I don't think a two-parameter Weibull would work as well.

Edit Worrying about ML or not ML is not a first consideration. Before that let's further examine which distribution is in play. So how did Sjoerd C. de Vries, in his answer, know to try a three parameter Weibull distribution other by doing something like I did above? Here is another way of showing a three parameter Weibull.

fit=NonlinearModelFit[data2,kk PDF[WeibullDistribution[a0,a1,a2],x],{kk,a0,a1,a2},x,WorkingPrecision->30,MaxIterations->1000];
Show[ListPlot[data2],Plot[fit[x],{x,18,30}],Frame->True]
fit["BestFitParameters"]
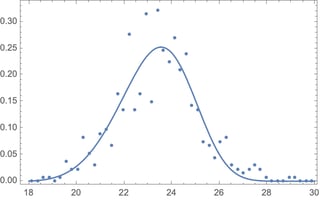
enter image description here

{kk->0.964661496866093819527120602321,a0->4.72300143536200858818774078537,a1->6.80075698971527535007544086964,a2->17.0803838666758819512633107980}

Further steps are to model the data as is, e.g., with a Poisson loss function as it is count data (see JimB's answer) and note that we haven't proven anything here. We still need to test distributions for goodness of fit to gain more insight.

Also note this post https://mathematica.stackexchange.com/a/104279/42558, which includes

(* GerneralizedLinearModelFit - logically the same as maximum
likelihood estimate *)
glm = GeneralizedLinearModelFit[data, xx^2, xx,
ExponentialFamily -> "Poisson", LinearOffsetFunction -> 1,
IncludeConstantBasis -> False, LinkFunction -> "IdentityLink",
WorkingPrecision -> 100];

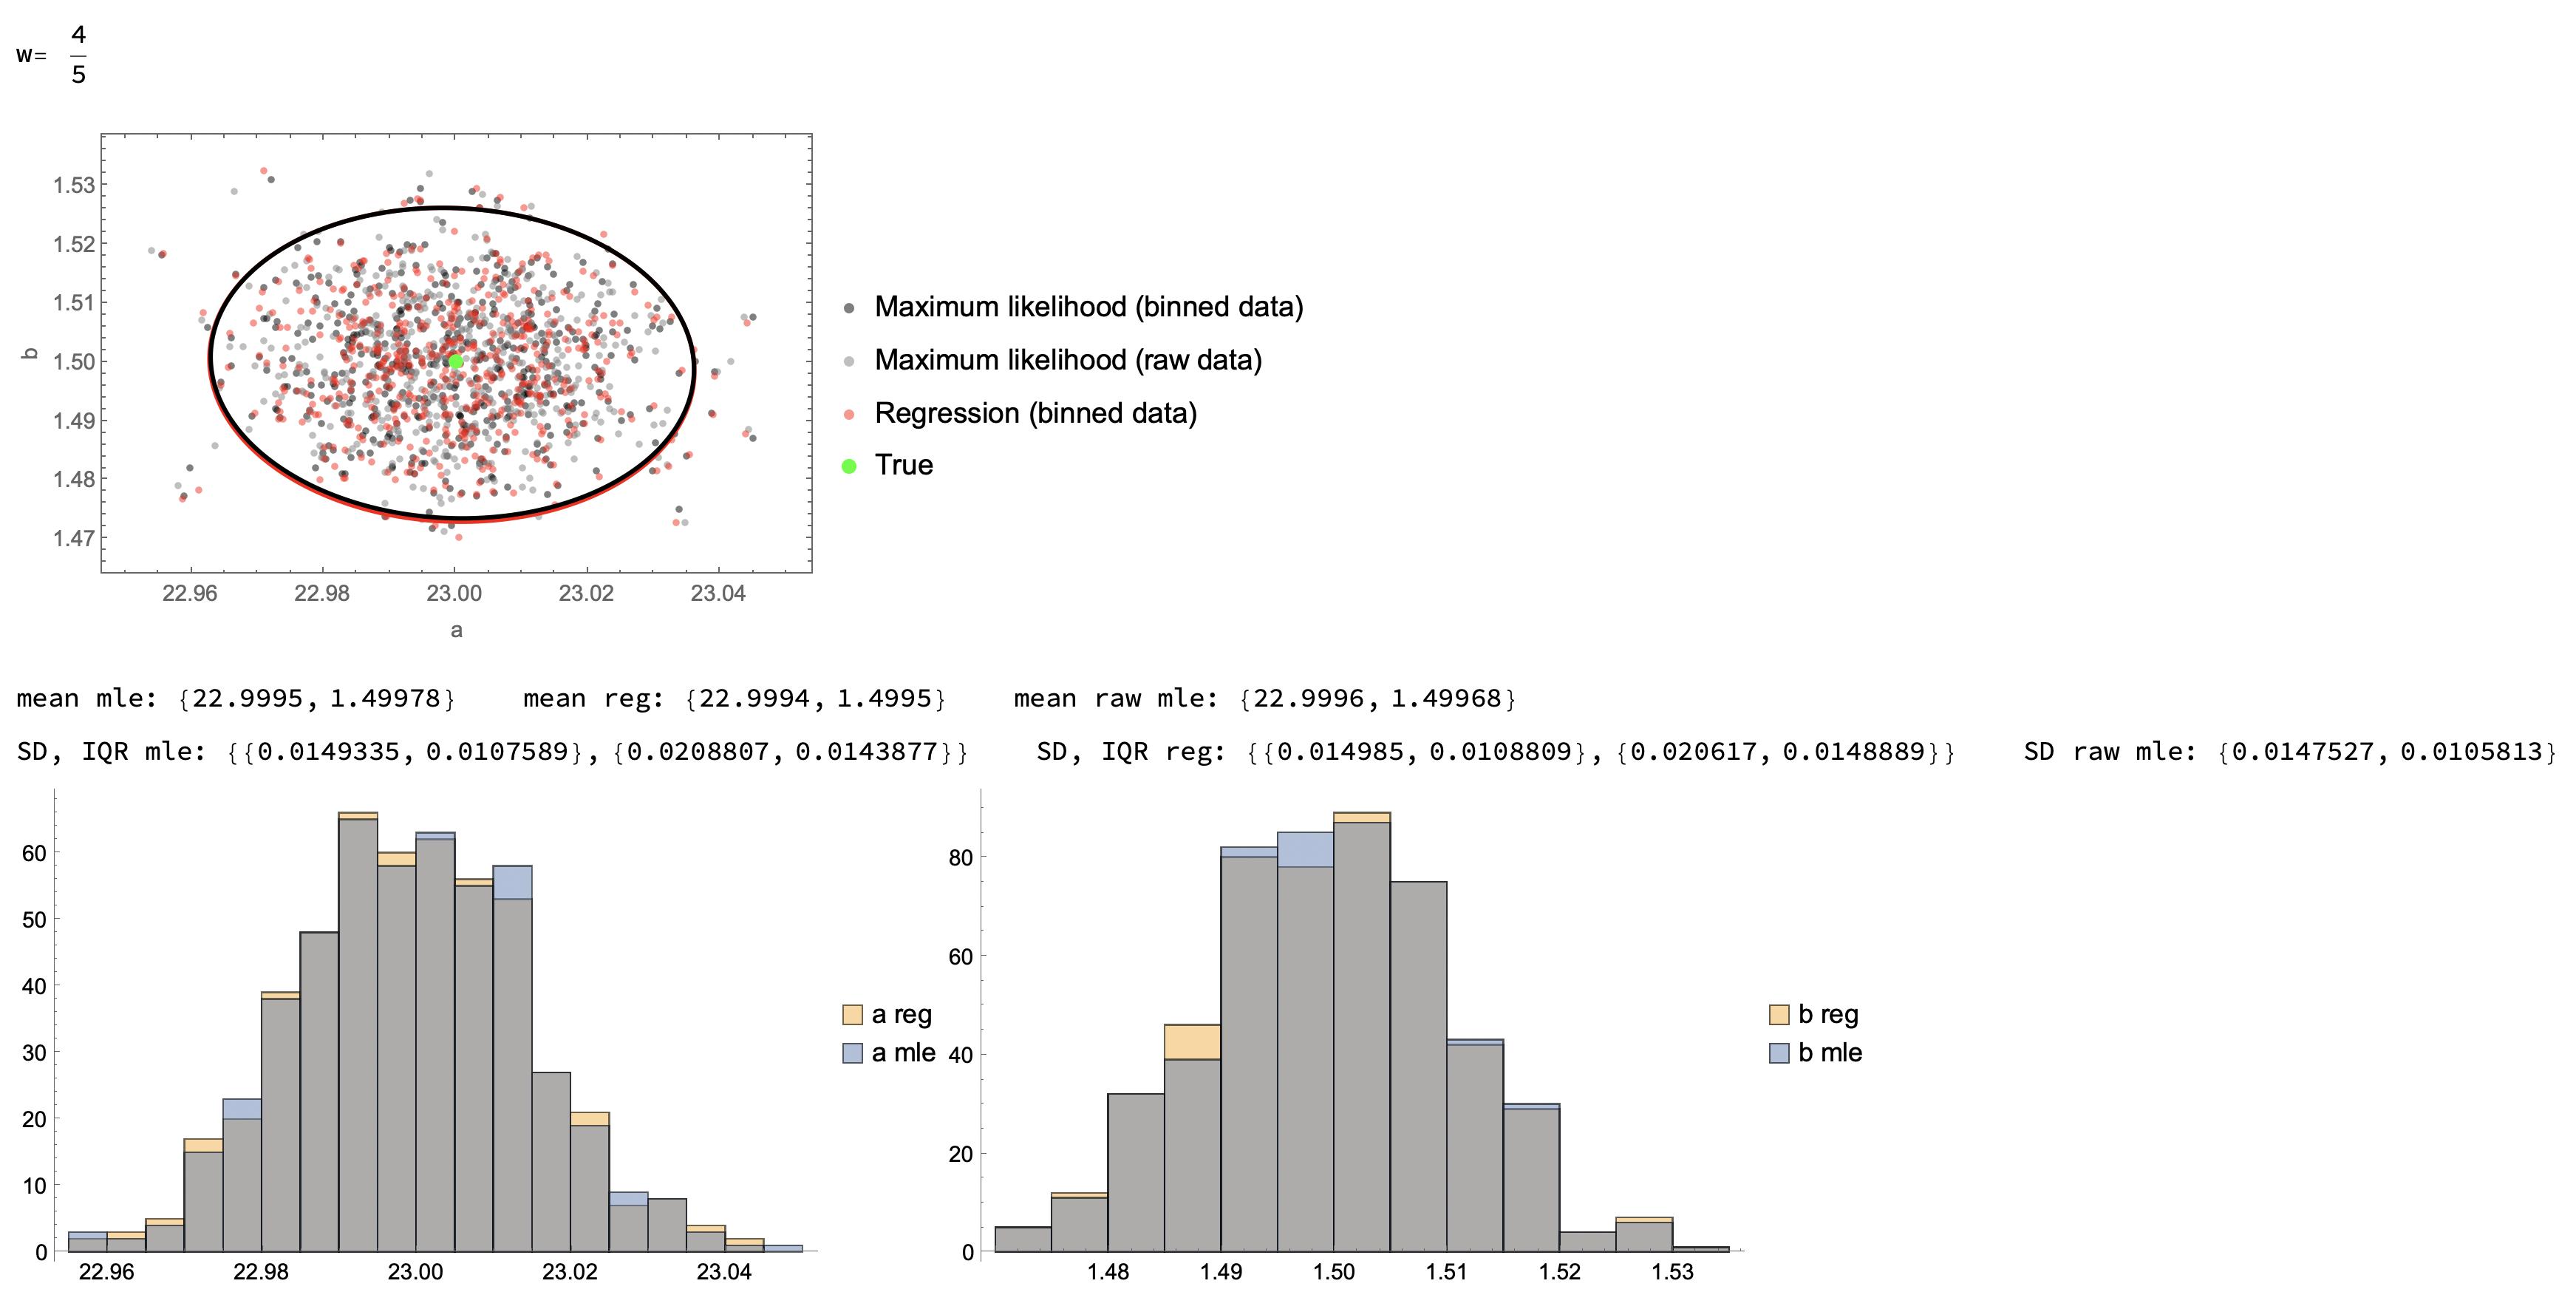
That is, if we have a Poisson process, and model it as such, the claim is that it will not differ from ML. To show this, with work in the chat link https://chat.stackexchange.com/rooms/137349/room-for-jimb-and-carl, the results of modelling are from simulation of a normal distribution with a sample size of 10000 performed 500 times. The synthetic mean "truth" value is 23 and the "true" SD is 3/2. Notice that the 95% tolerance ellipses largely superimpose, and the fits themselves are from fitting of bin width convolution of the normal distribution in both cases, MLE binned fitting, and regression binned fitting. To claim that regression is somehow inferior in quality to MLE, we would need to be careful as to which context we are speaking of, and in this case, there doesn't seem to be much of a difference for binned data.
enter image description here

To do ML, we can use @JimB's guess as to what the number of realizations are in each bin, duplicate that many samples in each bin at the bin location, and just use FindDistributionParameters, which is an ML procedure:

data3 = Rationalize[{{18.6, 1}, {18.84, 1}, {19.32, 1}, {19.56, 
5}, {19.8, 3}, {20.04, 3}, {20.28, 11}, {20.52, 7}, {20.76, 
4}, {21, 12}, {21.24, 13}, {21.48, 9}, {21.72, 22}, {21.96, 
18}, {22.2, 37}, {22.44, 18}, {22.68, 22}, {22.92, 42}, {23.16, 
20}, {23.4, 43}, {23.64, 33}, {23.88, 30}, {24.12, 36}, {24.36, 
28}, {24.6, 32}, {24.84, 19}, {25.08, 18}, {25.32, 10}, {25.56, 
9}, {25.8, 6}, {26.04, 10}, {26.28, 11}, {26.52, 4}, {26.76, 
3}, {27, 2}, {27.24, 3}, {27.48, 4}, {27.72, 3}, {27.96, 
1}, {28.92, 1}, {29.16, 1}}, 0]; 
datamess = Flatten[Table[data3[[i, 1]], {i, Length[data3]}, {j, 1, data3[[i, 2]]}]];

H1 = FindDistributionParameters[datamess, WeibullDistribution[a0, a1, a2], WorkingPrecision -> 30]
QQ1 = QuantilePlot[datamess, WeibullDistribution[a0, a1, a2] /. H1, PlotLabel -> "3 parm Weibull", ImageSize -> Medium];
H2 = FindDistributionParameters[datamess, WeibullDistribution[a0, a1], WorkingPrecision -> 30]
QQ2 = QuantilePlot[datamess, WeibullDistribution[a0, a1] /. H2, PlotLabel -> "2 parm Weibull", ImageSize -> Medium];
H3 = FindDistributionParameters[datamess, NormalDistribution[a0, a1], WorkingPrecision -> 30]
QQ3 = QuantilePlot[datamess, NormalDistribution[a0, a1] /. H3, PlotLabel -> "Normal", ImageSize -> Medium];
Print[QQ1, QQ2, QQ3]

Which gives us enter image description here From the QQ plots, we can see the problem with just duplicating samples, we get a dotted step pattern $...\cdots$. Despite this, it is quite clear that the Normal distribution (see left tail) fits slightly better than the 3 parameter Weibull, which in turn fits much better than the 2 parameter Weibull. In doing so, we are not so much concerned with getting an exact answer for each fit, but are answering the question as to which fit equation is appropriate. To see how to get reproducible answers that are largely methods independent, follow the procedure in the chat link. https://chat.stackexchange.com/rooms/137349/room-for-jimb-and-carl

$\endgroup$
10
  • $\begingroup$ This is not a regression problem and ‘FindFit’ is inappropriate for several reasons. $\endgroup$
    – JimB
    Commented Jun 26, 2022 at 6:25
  • $\begingroup$ @JimB Regression is also not inappropriate for several reasons. For one thing, it is likely MVUE given equidistant $x$-axis data as contrasted to a random variate. That is, there is no $x$-axis random variate, only $y$-axis variability such that least squares in $y$ is not inappropriate. I would like to see why you think this inappropriate, for example, MLR would assume random variate structure of the $x$-axis data, which information was destroyed by binning. So, please explain your reasoning, and if you wish we can continue this elsewhere. $\endgroup$
    – Carl
    Commented Jun 26, 2022 at 6:49
  • $\begingroup$ Let me count the ways: (1) the sample size is (almost certainly) 556 (the total frequency count) and not the number of bins (50), (2) The regression you use assumes a constant variance which is certainly not true (relative frequencies close to 0.5 have higher variance although somewhat reduced by having more observations), (3) Because of (1) and (2) the estimates of precision will not be appropriate – although FindFit doesn’t produce any estimates of precision which is another reason for not using FindFit. I'm sure I can find more reasons. $\endgroup$
    – JimB
    Commented Jun 26, 2022 at 17:01
  • $\begingroup$ However, I will concede that your approach can get one starting values for an appropriate approach such as maximum likelihood or the method of moments. $\endgroup$
    – JimB
    Commented Jun 26, 2022 at 17:03
  • $\begingroup$ I've set up a chat room as you have suggested: chat.stackexchange.com/rooms/137349/room-for-jimb-and-carl $\endgroup$
    – JimB
    Commented Jun 26, 2022 at 23:08

Your Answer

By clicking “Post Your Answer”, you agree to our terms of service and acknowledge you have read our privacy policy.

Not the answer you're looking for? Browse other questions tagged or ask your own question.