5
$\begingroup$

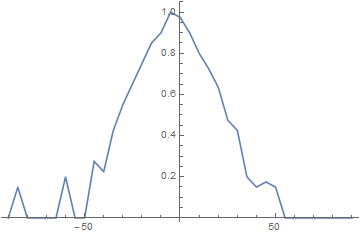
I want to plot the data that I got from measuring the angular dependency of the radiation intensity of a microwave emitter.

My data:

data = {
  {-90, 0}, {-85, 0.15}, {-80, 0}, {-75, 0}, {-70, 0}, {-65, 0}, {-60, 0.2}, 
  {-55, 0}, {-50, 0}, {-45, 0.275}, {-40, 0.225}, {-35, 0.425}, {-30, 0.55}, 
  {-25, 0.65}, {-20, 0.75}, {-15, 0.85}, {-10, 0.9}, {-5, 1}, {0, 0.975}, 
  {5, 0.9}, {10, 0.8}, {15, 0.725}, {20, 0.635}, {25, 0.475}, {30, 0.425}, 
  {35, 0.2}, {40, 0.15}, {45, 0.175}, {50, 0.15}, {55, 0}, {60, 0}, {65, 0}, 
  {70, 0}, {75, 0}, {80, 0}, {85, 0}, {90, 0}
}
enter image description here

As you can see my data ranges from -90 to 90 degree in 5 degree steps.

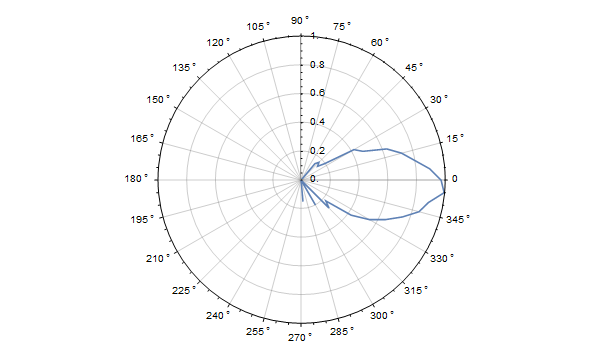
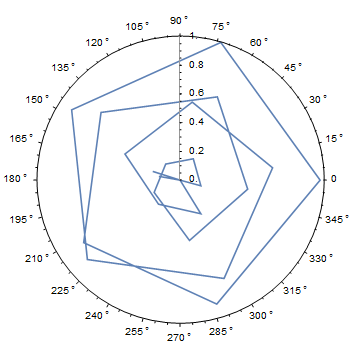
Now, if I try to plot this using ListPolarPlot[] it gets kind of messy:

ListPolarPlot[data, 
  PolarAxes -> True, PolarTicks -> {"Degrees", Automatic}, Joined -> True]
enter image description here

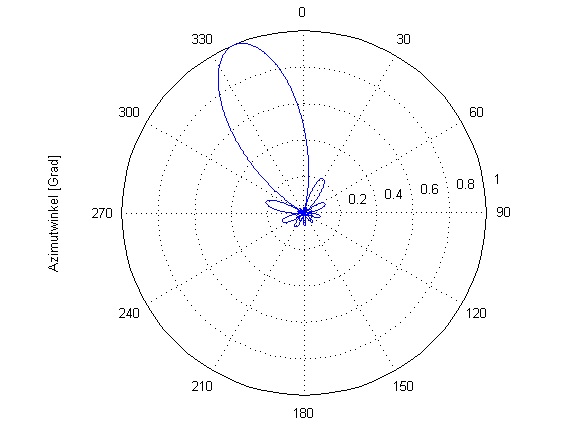
It should look somewhat like this:

enter image description here

What do I have to do to get a proper polar plot?

$\endgroup$
2
  • $\begingroup$ @m_goldberg Careful! you would be messing with the radiation intensity $\endgroup$
    – Ivan
    Commented Jul 13, 2015 at 3:01
  • $\begingroup$ @Ivan. You are right. I have retracted my comment. $\endgroup$
    – m_goldberg
    Commented Jul 13, 2015 at 3:30

2 Answers 2

6
$\begingroup$

You need the angles in radians in your data:

data2 = {#[[1]]*Pi/180, #[[2]]} & /@ data;

Or

data2 = {#[[1]] Degree, #[[2]]} & /@ data;

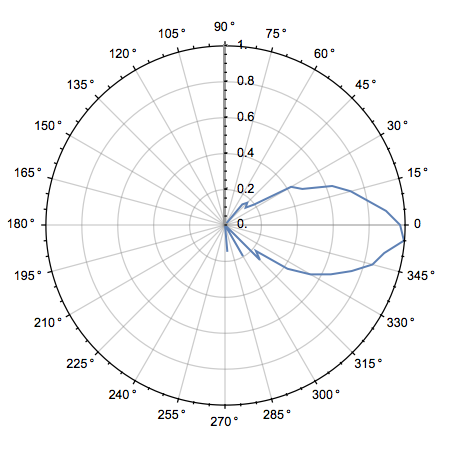
Then plot

ListPolarPlot[data2, PolarAxes -> True,
   PolarTicks -> {"Degrees", Automatic}, Joined -> True, PolarGridLines -> True]

enter image description here

UPDATE

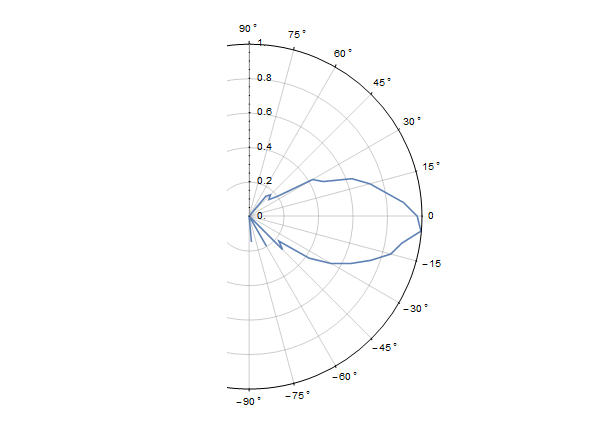
To show only part of the circle, play around with the PlotRange option. And to show negative angles, specify them in PolarThicks option.

 ListPolarPlot[data2, PolarAxes -> True, Joined -> True, PolarGridLines -> True,
    PolarTicks -> {Table[i, {i, -90, 90, 15}] Degree, Automatic},
    PlotRange -> {{0, 1}, {-1, 1}}]

enter image description here

$\endgroup$
4
  • 4
    $\begingroup$ BTW: Degree is built-in… $\endgroup$ Commented Jul 12, 2015 at 23:28
  • 1
    $\begingroup$ Thank you. Is there a way of only showing 90 to 270 degrees? And can I change 0,359,358,...,270 degree to 0,-1,-2,...-90 degree? $\endgroup$
    – kaos
    Commented Jul 13, 2015 at 10:53
  • $\begingroup$ @kaos I updated my post. Check it out. $\endgroup$
    – Ivan
    Commented Jul 13, 2015 at 20:06
  • $\begingroup$ Cool. Thank you :) $\endgroup$
    – kaos
    Commented Jul 13, 2015 at 20:34
4
$\begingroup$

You might try this simple way to convert your data.

data[[All, 1]] = data[[All, 1]] Degree
ListPolarPlot[data, 
  PolarAxes -> True, PolarGridLines -> True, PolarTicks -> {"Degrees", Automatic}, 
  Joined -> True]

plot

$\endgroup$
1
  • 2
    $\begingroup$ data[[All, 1]] *= Degree will work, too. $\endgroup$ Commented Jul 14, 2015 at 0:23

Your Answer

By clicking “Post Your Answer”, you agree to our terms of service and acknowledge you have read our privacy policy.

Not the answer you're looking for? Browse other questions tagged or ask your own question.