10
$\begingroup$

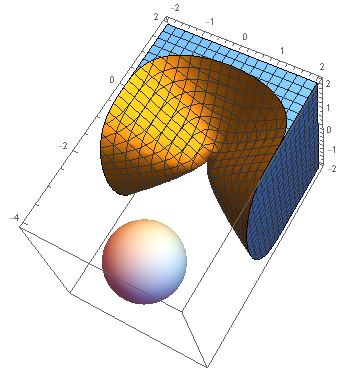
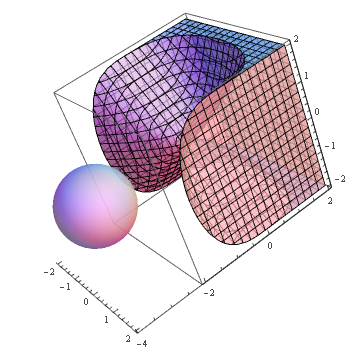
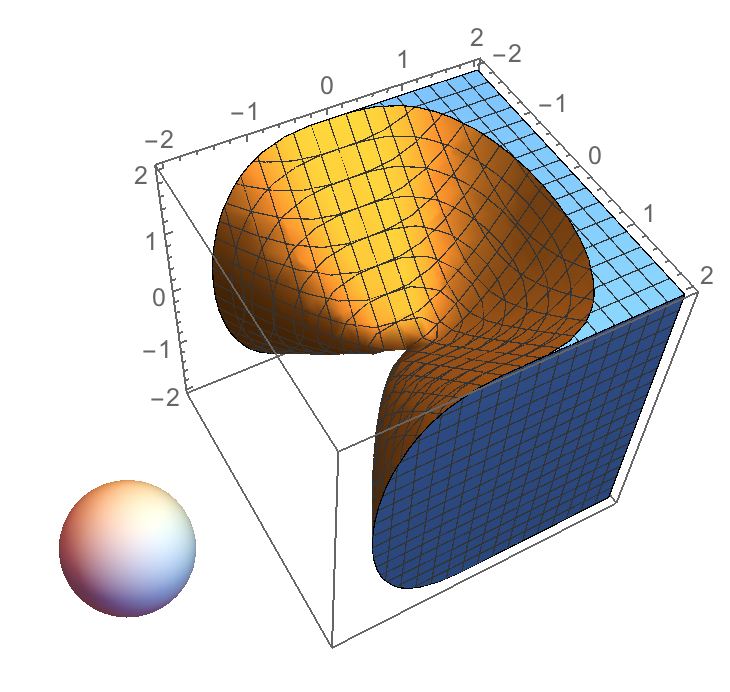
In the following example, I would like to Boxed only the RegionPlot3D, and not the Sphere.

That is, to obtain this:
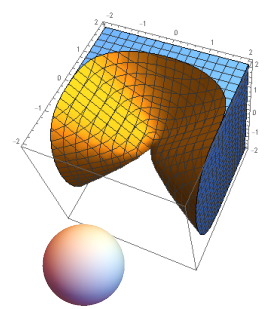
enter image description here

instead of this:

enter image description here

Here's the sample code:

Show[
  RegionPlot3D[x^2 + y^3 - z^2 > 0, {x, -2, 2}, {y, -2, 2}, {z, -2, 2}, 
    Boxed -> True, Axes -> True, BoxRatios -> Automatic], 
  Graphics3D[Sphere[{0, -3, 0}], Boxed -> False, Axes -> False], 
    PlotRange -> All]

Obviously, how to do it without a Rasterizeing trick!

Comment: there should really be an easy access to the axes primitives...

EDIT

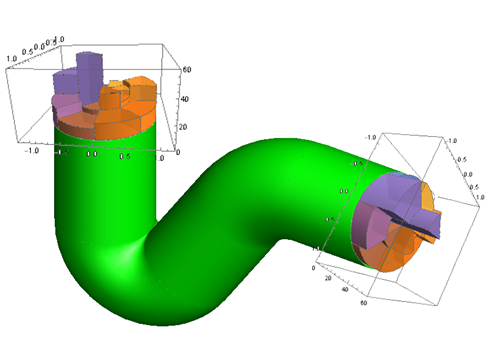
Just to let you know of my real case: I have imported a 3D CAD scene (simple STL always works), with some pipes (industrial kind of thing), and I have field measurements taken from multiple points located at each of the pipes' extremities cross sections. I wanted to join this data, as multiple 3d plots glued to their corresponding pipe extremity (overlap the plot z=0 face with the pipe start/end extremity cross section face), so to easy the data interpretation (orientation in respect to the machine, etc).
enter image description here

(the above is a mockup image)

(also, sometimes data fits better into a SectorChart3D, sometimes into a a simple Plot3D, etc)

So, the original post example is an extremely simplified version of a real case... where local coordination system's axis are needed, including position, rotation, and scale! (since the measured parameter values might be very different from the physical dimension of the underneath 3D model, or of the other plots in the, which means that they should be independent).

And yet, it shouldn't be too complicated, right?

Wrong! Forgetting the Boxed for a moment, and just thinking at position, rotation and scaling is a nightmare... (for instance, plot scale is defined by box ratios, etc. ... you get the point).

The functions available to create kind of local coordinates systems, to redefine position, rotation an re-scaling of a set of primitives, are not easy to use... (or probably not intended for setting LCS's).

(and most interesting is the fact that this real case would still be complicated to perform in plain 2D...)

EDIT 2

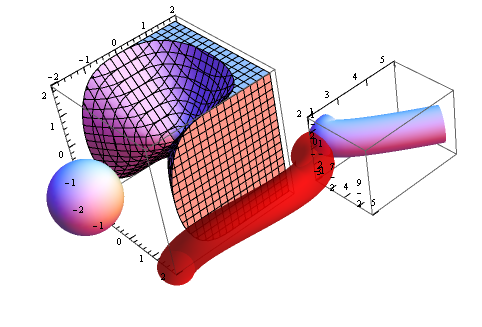
Having played around with the answer from kguler, I can say that it works good enough, although when rotating the plot, it doesn't present the Mathematica automation of the scale position, selecting the axes that is most "visible" (but that sometimes can also be irritating).

$\endgroup$

2 Answers 2

6
$\begingroup$

Update: Recycling the function tickF from this answer to construct a function, axesF, to create axes and ticks primitives, to get

enter image description here

ClearAll[tickF, axesF, boxF];
tickF[div1_, div2_: - 1] := (If[div2 == -1,Thread[{#, #, {.02, 0}}, List, 2] &@
      FindDivisions[{#1, #2}, div1], 
     Join @@ MapAt[Join @@ # &, {Thread[{#, #, {.02, 0}}, List, 2] &@#[[1]], 
          Thread[{#, "", {.01, 0}}, List, 2] & /@ #[[2]]} &@
        FindDivisions[{#1, #2}, {div1, div2}], {2}]]) &;

axesF[div1_, div2_: - 1][gr_] := With[{pr = PlotRange[gr], 
    ticks = tickF[div1, div2] @@@ PlotRange[gr], 
    min = Transpose[PlotRange[gr]][[1]], 
    max = Transpose[PlotRange[gr]][[2]]}, 
   Flatten@{{Text[#2, {1, 1.2, 1.} {#1 + #3[[1]], min[[2]], min[[3]]}], 
        Line[1.05 {min, {max[[1]], min[[2]], min[[3]]}}], 
        Line[1.05 {{#1 + #3[[1]], min[[2]], min[[3]]}, {#1 + #3[[1]], 
            min[[2]] + If[#2 == "", .1, .2], min[[3]]}}]} & @@@ ticks[[1]],
     {Text[#2, {1., 1., 1.2} {min[[1]], #1 + #3[[1]], max[[3]]}], 
        Line[1.05 {{min[[1]], min[[2]], max[[3]]}, {min[[1]], max[[2]], max[[3]]}}], 
        Line[1.05 {{min[[1]], #1 + #3[[1]], max[[3]]}, {min[[1]], #1 + #3[[1]], 
            max[[3]] - If[#2 == "", .1, .2]}}]} & @@@ ticks[[2]],
     {Text[#2, {1., 1.2, 1} {min[[1]], min[[2]], #1 + #3[[1]]}], 
        Line[1.05 {min, {min[[1]], min[[2]], max[[3]]}}], 
        Line[1.05 {{min[[1]], min[[2]], #1 + #3[[1]]}, {min[[1]], 
            min[[2]] + If[#2 == "", .1, .2], #1 + #3[[1]]}}]} & @@@ ticks[[3]]}];

boxF[divs__][gr_] := Graphics3D[{axesF[divs][gr], gr[[1]], 
    EdgeForm[{AbsoluteThickness[.2], GrayLevel[.4]}], FaceForm[], 
    Cuboid @@ (1.05 Transpose[PlotRange[gr]])}, Boxed -> False];

Example: the picture above produced by

Show[rp = RegionPlot3D[x^2 + y^3 - z^2 > 0, {x, -2, 2}, {y, -2, 2}, {z, -2, 2}], 
 Graphics3D[{Opacity[1], Sphere[{0, -3, 0}]}], boxF[5, 5][rp],
 Graphics3D[{CapForm["Butt"], Opacity[.7], Red, 
   Tube[BezierCurve[{{2, -2, -2}, {3, -2, 0}, {5, 2, 0}, {3, 2, 0}}], .5]}], 
 boxF[4]@Graphics3D[{CapForm["Butt"], 
    Tube[BezierCurve[{{3, 3, 0}, {3, 2, 0}, {5, 5, 0}}], .5]}],
 PlotRange -> All, Axes -> False, BoxRatios -> Automatic, 
 Boxed -> False, ImageSize -> 500]

Needless to say, both the code and functionality has a lot of room for improvement.


Original post:

A small step as a partial solution for the easier part of the question:

Show[rp = RegionPlot3D[x^2 + y^3 - z^2 > 0, {x, -2, 2}, {y, -2, 2}, {z, -2, 2}, 
   Boxed -> True, Axes -> True, BaseStyle -> Opacity[.7], BoxRatios -> Automatic], 
 Graphics3D[{Sphere[{0, -3, 0}], EdgeForm[{AbsoluteThickness[.2], GrayLevel[.4]}], 
   FaceForm[], Cuboid @@ (1.05 Transpose[PlotRange[rp]])}], 
 PlotRange -> All, Boxed -> False, PlotRangePadding -> 0]

enter image description here

$\endgroup$
7
  • $\begingroup$ Thank you for the suggestion. I have edited the question with a new image, to explain better the purpose of my original simple request. $\endgroup$
    – P. Fonseca
    Commented Apr 21, 2015 at 10:29
  • $\begingroup$ This is much closer than before! Two comments: 1) there's a bug that needs reporting (I'm on 10.0.2): when you right-click the plot and select, for instance, top view, the numbers get misplaced and all grouped at a corner; 2) any easy way of adding a local coordinate system capacity (both in zero location, scale and rotation), as per my example image? $\endgroup$
    – P. Fonseca
    Commented Apr 21, 2015 at 12:29
  • $\begingroup$ @P.Fonseca, i get the same jumbled text in version 9.0.1.0 (windows 8); no idea how to fix it. Re rotation and scale it should be possible using GeometricTransformation on individual elements. $\endgroup$
    – kglr
    Commented Apr 21, 2015 at 12:36
  • $\begingroup$ e.g. Graphics3D[ GeometricTransformation[ GeometricTransformation[ boxF[4][Graphics3D[{CapForm["Butt"], Tube[BezierCurve[{{3, 3, 0}, {3, 2, 0}, {5, 5, 0}}], .5]}]][[1]], ScalingMatrix[2, {1, 1, 1}]], ReflectionMatrix[{1, 1, 1}]], Boxed -> False] $\endgroup$
    – kglr
    Commented Apr 21, 2015 at 12:40
  • $\begingroup$ @P.Fonseca, I have never done a bug report (or used wolfram support in any form). Do you mind doing it? $\endgroup$
    – kglr
    Commented Apr 21, 2015 at 12:42
5
$\begingroup$

There's no clean way to do this without re-creating the box and axes yourself. So here is how far I managed to get by just abusing Inset:

Show[RegionPlot3D[
  x^2 + y^3 - z^2 > 0, {x, -2, 2}, {y, -2, 2}, {z, -2, 2}, 
  Boxed -> True, Axes -> True, BoxRatios -> Automatic], Graphics3D[
  Inset[
   Graphics[
    Inset[
     Graphics3D[Sphere[{0, 0, 0}], 
      PlotRange -> {{-1, 1}, {-1, 10}, {-1, 1}}, Boxed -> False, 
      Axes -> False], {0, 0}]], {0, -2, 0}]], PlotRange -> All]

sphere

The first Inset is inside the 3D view, positioned at the edge of the plot range. Inside of it is a 2D Graphics containing another 3D Inset that has the sphere in it, with a PlotRange specification that places the sphere off-center, shifted outside of the original PlotRange.

The sphere does rotate together with the main box as part of the 3D scene, but its alignment isn't very easy to control - I needed some trial and error. Also, the box lines are always shown in front of the Inset, and I don't think there's any option to turn that behavior off.

$\endgroup$
5
  • $\begingroup$ Interesting (although also kind of torturous) way! This is a little too complexe to be practical. But thank you for the answer. It's a pity if there's really no practical way. I can imagine many different scenarios and variants of this need: multiple boxes in the same scene, referring to the same global coordination system, or, each one, to its local coordination system, etc. and all this would be so easy if the box primitives were there... (and the same applies to 2d plots, and all the multiple axes kind of problems, although in 2d it is easier to trick...) $\endgroup$
    – P. Fonseca
    Commented Apr 21, 2015 at 5:39
  • $\begingroup$ Indeed - and moreover, in version 8 the result can't be rotated... so this is really a hack. I completely agree that we need better control over the axes (and frame, and ticks, etc.) for 2D and 3D plots! It seems nothing has really happened on that front since the stone age. $\endgroup$
    – Jens
    Commented Apr 21, 2015 at 5:45
  • $\begingroup$ @P.Fonseca: Also, it does not guarantee to be true to scale and requires caution. However, used correctly, it just works. Nice approach! $\endgroup$
    – Jinxed
    Commented Apr 21, 2015 at 6:07
  • $\begingroup$ @Jinxed but suppose you have three or four more Graphics3D. Would it still work? It works for this simple exercise (which is more than I was expecting! and I thank Jens again for the effort), but it is too complicate to make it work in really life... $\endgroup$
    – P. Fonseca
    Commented Apr 21, 2015 at 6:18
  • $\begingroup$ @P.Fonseca: I'm not too glad, either. $\endgroup$
    – Jinxed
    Commented Apr 21, 2015 at 6:20

Your Answer

By clicking “Post Your Answer”, you agree to our terms of service and acknowledge you have read our privacy policy.

Not the answer you're looking for? Browse other questions tagged or ask your own question.