edited tags
Link
replaced http://mathematica.stackexchange.com/ with https://mathematica.stackexchange.com/
Source Link

Three months ago, I asked a quesion about B-Spline basis function herehere, Today, I used this function to plot B-spline curve.

See [george2079's solution](httphttps://mathematica.stackexchange.com/questions/71778/how-to-speed-up-the-plotting-of-b-spline-curve/71818#71818) and [my answer](httphttps://mathematica.stackexchange.com/questions/71778/how-to-speed-up-the-plotting-of-b-spline-curve/72180#72180)

Three months ago, I asked a quesion about B-Spline basis function here, Today, I used this function to plot B-spline curve.

See [george2079's solution](http://mathematica.stackexchange.com/questions/71778/how-to-speed-up-the-plotting-of-b-spline-curve/71818#71818) and [my answer](http://mathematica.stackexchange.com/questions/71778/how-to-speed-up-the-plotting-of-b-spline-curve/72180#72180)

Three months ago, I asked a quesion about B-Spline basis function here, Today, I used this function to plot B-spline curve.

See [george2079's solution](https://mathematica.stackexchange.com/questions/71778/how-to-speed-up-the-plotting-of-b-spline-curve/71818#71818) and [my answer](https://mathematica.stackexchange.com/questions/71778/how-to-speed-up-the-plotting-of-b-spline-curve/72180#72180)
deleted 2303 characters in body
Source Link
xyz
  • 655
  • 4
  • 38
  • 117

###Trail 1 (Update) with george2079's solution

(Update) with george2079's solution

 ptspts3 = {{01, 06}, {02, 28}, {23, 36}, {4, 012}, {67, 11}, {9, 3}, {812, 27}, {14, 5}, {15, 8}, 0{17, 8}};
 knots =knots3= {0, 0, 0, 1/58, 2/58, 3/58, 4/8, 5/8, 6/8, 7/8, 1, 1, 1};

 BSplinePlot1[ptsBSplinePlot1[pts3, knotsknots3, ImageSize -> 600]

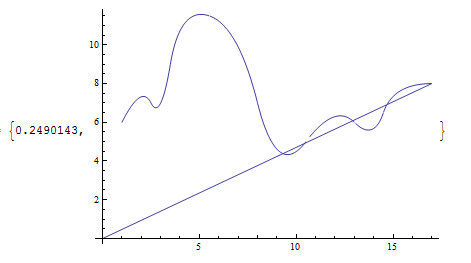
enter image description hereenter image description here

###Trail 2###Update

  • Is there any method to speed up the calculation of NBSPline?
 Options[BSplinePlot] = {ShowPoints -> True};
 
See BSplinePlot2[pts[george2079's solution](http: {{_, _} //mathematica.stackexchange.}, knots_,
  opts : OptionsPattern[{Plot, BSplinePlot}]] :=
 Module[{p = Length@First@Split[knots] com/questions/71778/how- 1, a, b},
  {a, b} = {First[knots], Last[knots]};
  ParametricPlot[
   Total@ 
    MapIndexed[
     NBSpline[First@#2 to- 1, p, knots, u] #1 &, pts], {u, a, speed-up-the-plotting-of-b},
     Sequence @@ FilterRules[{opts}, Options[Plot]],
   Epilog ->
    If[OptionValue[ShowPoints],
     Join[
      Text @@@
       (Thread@
        {Table[
          Style[Subscript["P", i], 14], {i, 0, Length@pts spline- 1}], # + {.4, .2} & curve/@  pts}71818#71818), {Red, 
 and [my PointSize[0answer](http://mathematica.015], Point[pts], Green, Line[pts]}], Sequence[]]]
 ]     

Test2

 BSplinePlot2[pts, knots, PlotRange stackexchange.com/questions/71778/how-> {{0, 10}, {0, 5}}, ShowPoints to-> True]speed-up-the-plotting-of-b-spline-curve/72180#72180)

"Range specification
Sequence@@FilterRules[{PlotRange->{{0,10},{0,5}},ShowPoints->True},
Options[Plot]] is not of the form {x, xmin, xmax}."


###My question:

  • Is there any method to speed up the calculation of NBSPline?

  • How to deal with the problem of discontinuity shown in the first graph?

  • I cannot understand the warning information of Test2

    How to deal with the problem of discontinuity shown in the first graph?

#Update

Thanks for @george2079's solution,Add the efficiency has improvedoption 10X

However, I found another problemPlotPoints

  dynamicBSplinePlot[pts : {{_, _} ..}, knots_, 
   opts : OptionsPattern[Plot]] :=
   DynamicModule[{points = pts, p = Length@First@Split[knots] - 1, a, b},
    {a, b} = {First[knots], Last[knots]};
    LocatorPane[
     Dynamic[points],
     Dynamic@
      ParametricPlot[
      Evaluate[
       Simplify@
       Total@
        MapIndexed[NBSpline[First@#2 - 1, p, knots, u] #1 &, points]], {u, a, b},    opts,
  Epilog ->
   Join[
    Text @@@
     (Thread@{Table[
        Style[Subscript["P", i], 14], {i, 0, 
         Length@points - 1}], # + {.4, .2} & /@ points}),
   {Red, PointSize[0.015], Point[points], Green, Line[points]}]]
 ]
]

pts2 = {{0, 0}, {0, 2}, {2, 3}, {4, 0}, {6, 3}, {8, 2}, {8, 0}, {9, 9}};
knots2 = {0, 0, 0, 0, 1/5, 2/5, 3/5, 4/5, 1, 1, 1, 1};

dynamicBSplinePlot[pts2, knots2, PlotRange -> {{0, 10}, {0, 10}}]
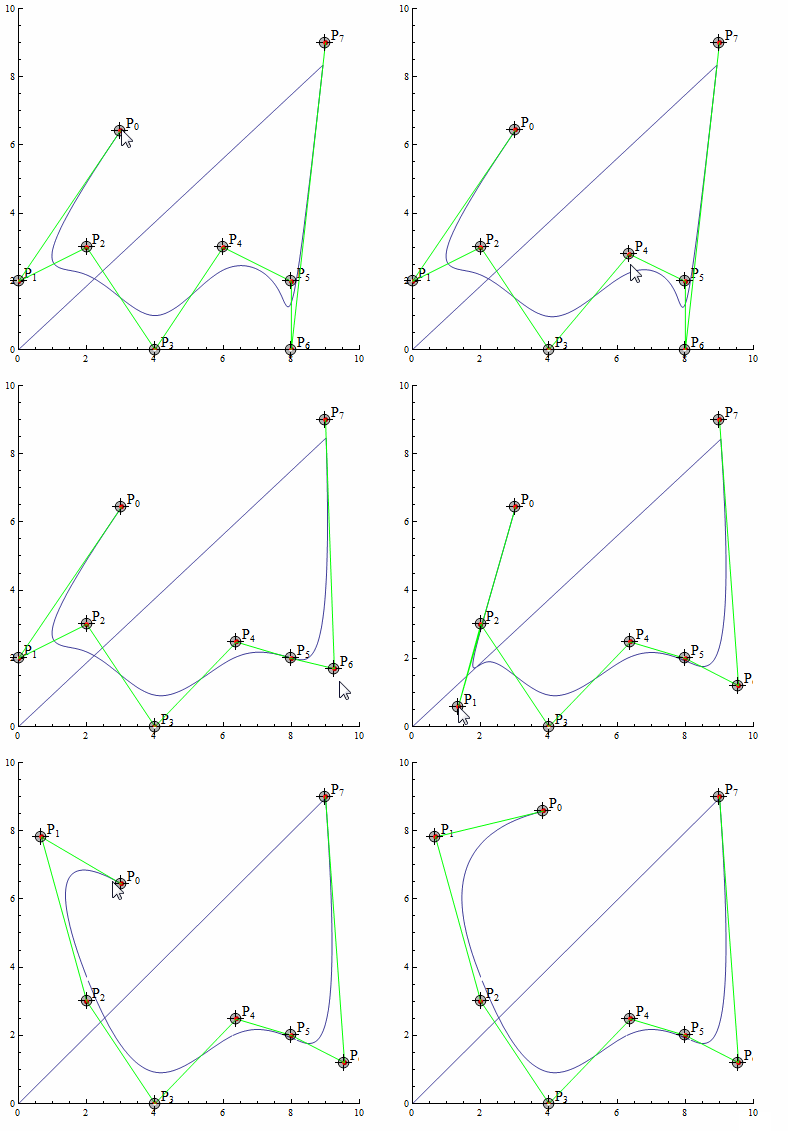
enter image description here

enter image description here

###Trail 1 (Update) with george2079's solution

 pts = {{0, 0}, {0, 2}, {2, 3}, {4, 0}, {6, 3}, {8, 2}, {8, 0}};
 knots = {0, 0, 0, 1/5, 2/5, 3/5, 4/5, 1, 1, 1};

 BSplinePlot1[pts, knots, ImageSize -> 600]

enter image description here

###Trail 2

 Options[BSplinePlot] = {ShowPoints -> True};
 
 BSplinePlot2[pts : {{_, _} ..}, knots_,
  opts : OptionsPattern[{Plot, BSplinePlot}]] :=
 Module[{p = Length@First@Split[knots] - 1, a, b},
  {a, b} = {First[knots], Last[knots]};
  ParametricPlot[
   Total@ 
    MapIndexed[
     NBSpline[First@#2 - 1, p, knots, u] #1 &, pts], {u, a, b},
     Sequence @@ FilterRules[{opts}, Options[Plot]],
   Epilog ->
    If[OptionValue[ShowPoints],
     Join[
      Text @@@
       (Thread@
        {Table[
          Style[Subscript["P", i], 14], {i, 0, Length@pts - 1}], # + {.4, .2} & /@  pts}), {Red, 
   PointSize[0.015], Point[pts], Green, Line[pts]}], Sequence[]]]
 ]     

Test2

 BSplinePlot2[pts, knots, PlotRange -> {{0, 10}, {0, 5}}, ShowPoints -> True]

"Range specification
Sequence@@FilterRules[{PlotRange->{{0,10},{0,5}},ShowPoints->True},
Options[Plot]] is not of the form {x, xmin, xmax}."


###My question:

  • Is there any method to speed up the calculation of NBSPline?

  • How to deal with the problem of discontinuity shown in the first graph?

  • I cannot understand the warning information of Test2


#Update

Thanks for @george2079's solution, the efficiency has improved 10X

However, I found another problem

  dynamicBSplinePlot[pts : {{_, _} ..}, knots_, 
   opts : OptionsPattern[Plot]] :=
   DynamicModule[{points = pts, p = Length@First@Split[knots] - 1, a, b},
    {a, b} = {First[knots], Last[knots]};
    LocatorPane[
     Dynamic[points],
     Dynamic@
      ParametricPlot[
      Evaluate[
       Simplify@
       Total@
        MapIndexed[NBSpline[First@#2 - 1, p, knots, u] #1 &, points]], {u, a, b},    opts,
  Epilog ->
   Join[
    Text @@@
     (Thread@{Table[
        Style[Subscript["P", i], 14], {i, 0, 
         Length@points - 1}], # + {.4, .2} & /@ points}),
   {Red, PointSize[0.015], Point[points], Green, Line[points]}]]
 ]
]

pts2 = {{0, 0}, {0, 2}, {2, 3}, {4, 0}, {6, 3}, {8, 2}, {8, 0}, {9, 9}};
knots2 = {0, 0, 0, 0, 1/5, 2/5, 3/5, 4/5, 1, 1, 1, 1};

dynamicBSplinePlot[pts2, knots2, PlotRange -> {{0, 10}, {0, 10}}]
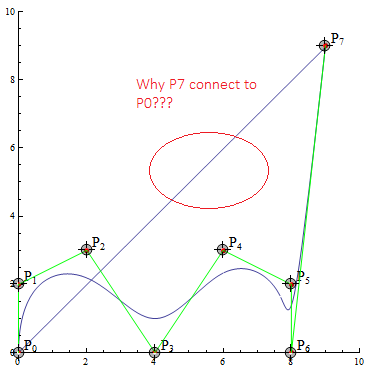
enter image description here

enter image description here

###Trail 1

(Update) with george2079's solution

 pts3 = {{1, 6}, {2, 8}, {3, 6}, {4, 12}, {7, 11}, {9, 3}, {12, 7}, {14, 5}, {15, 8}, {17, 8}};
 knots3= {0, 0, 0, 1/8, 2/8, 3/8, 4/8, 5/8, 6/8, 7/8, 1, 1, 1};

 BSplinePlot1[pts3, knots3, ImageSize -> 600]

enter image description here

###Update

  • Is there any method to speed up the calculation of NBSPline?
See [george2079's solution](http://mathematica.stackexchange.com/questions/71778/how-to-speed-up-the-plotting-of-b-spline-curve/71818#71818) and [my answer](http://mathematica.stackexchange.com/questions/71778/how-to-speed-up-the-plotting-of-b-spline-curve/72180#72180)
  • How to deal with the problem of discontinuity shown in the first graph?

Add the option PlotPoints

Tweeted twitter.com/#!/StackMma/status/555979380661694464
added 1264 characters in body
Source Link
xyz
  • 655
  • 4
  • 38
  • 117
Loading
added 85 characters in body
Source Link
xyz
  • 655
  • 4
  • 38
  • 117
Loading
added 241 characters in body
Source Link
xyz
  • 655
  • 4
  • 38
  • 117
Loading
added 3 characters in body
Source Link
xyz
  • 655
  • 4
  • 38
  • 117
Loading
Source Link
xyz
  • 655
  • 4
  • 38
  • 117
Loading