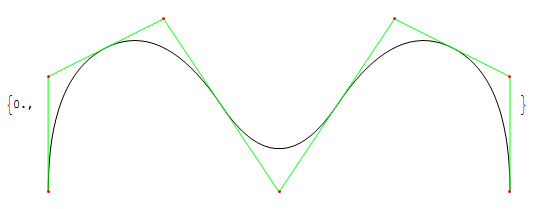
Three months ago, I asked a quesion about B-Spline basis function here, Today, I used this function to plot B-spline curve.
The definition of $N_{i,p}$
  NBSpline[i_Integer, 0, knots_?(VectorQ[#, NumericQ] && OrderedQ[#] &),u_] /;
   i <= Length[knots] - 2 :=
  Piecewise[
   {{1, knots[[i + 1]] <= u < knots[[i + 2]]},
    {0, u < knots[[i + 1]] || u >= knots[[i + 2]]}}]

  coeff[u_, i_, j_, knots_] /; knots[[i]] == knots[[j]] := 0;
  coeff[u_, i_, j_, knots_] := (u - knots[[i]])/(knots[[j]] - knots[[i]])

  NBSpline[i_Integer, p_Integer, knots_?(VectorQ[#, NumericQ] && OrderedQ[#] &),
    u_] /;p > 0 && i + p <= Length[knots] - 2 :=
   Module[{init, res},
    init = Table[NBSpline[j, 0, knots, u], {j, i, i + p}];
    res = First@Simplify@
    Nest[
     Dot @@@
      (Thread@
        {Partition[#, 2, 1],
         With[{m = p + 2 - Length@#},
          Table[
           {coeff[u, k + 1, k + m + 1, knots],
            coeff[u, k + m + 2, k + 2, knots]}, {k, i, i + Length@# - 2}]]}) &,
    init, p]
  ]
The definition of B-Spline
$$\overset{\rightharpoonup }{C}(u)=\sum _{i=0}^n N_{i,p}(u) \overset{\rightharpoonup }{P}_i \text{ }\qquad (a\leq u\leq b)$$
where, $P_i$ is the control points
###Trail 1
 BSplinePlot1[pts : {{_, _} ..}, knots_, opts : OptionsPattern[Plot]] :=
 Module[{p = Length@First@Split[knots] - 1, a, b},
  {a, b} = {First[knots], Last[knots]};
  ParametricPlot[
  Total@
   MapIndexed[
    NBSpline[First@#2 - 1, p, knots, u] #1 &, pts], {u, a, b}, opts
 ]
]
Test1
 pts = {{0, 0}, {0, 2}, {2, 3}, {4, 0}, {6, 3}, {8, 2}, {8, 0}};
 knots = {0, 0, 0, 1/5, 2/5, 3/5, 4/5, 1, 1, 1};

 BSplinePlot1[pts, knots, ImageSize -> 600]
 Graphics[{BSplineCurve[pts, SplineKnots -> knots], Green, Line[pts],
  Red, Point[pts]}] // AbsoluteTiming
###Trail 2
 Options[BSplinePlot] = {ShowPoints -> True};

 BSplinePlot2[pts : {{_, _} ..}, knots_,
  opts : OptionsPattern[{Plot, BSplinePlot}]] :=
 Module[{p = Length@First@Split[knots] - 1, a, b},
  {a, b} = {First[knots], Last[knots]};
  ParametricPlot[
   Total@
    MapIndexed[
     NBSpline[First@#2 - 1, p, knots, u] #1 &, pts], {u, a, b},
     Sequence @@ FilterRules[{opts}, Options[Plot]],
   Epilog ->
    If[OptionValue[ShowPoints],
     Join[
      Text @@@
       (Thread@
        {Table[
          Style[Subscript["P", i], 14], {i, 0, Length@pts - 1}], # + {.4, .2} & /@  pts}), {Red,
   PointSize[0.015], Point[pts], Green, Line[pts]}], Sequence[]]]
 ]
Test2
BSplinePlot2[pts, knots, PlotRange -> {{0, 10}, {0, 5}}, ShowPoints -> True]
"Range specification
Sequence@@FilterRules[{PlotRange->{{0,10},{0,5}},ShowPoints->True},
Options[Plot]] is not of the form {x, xmin, xmax}."
###My question:
Is there any method to speed up the calculation of
NBSPline?How to deal with the problem of discontinuity shown in the first graph?
I cannot understand the warning information of
Test2


