6
$\begingroup$

Bug introduced in 10.0 and fixed in 10.3 or earlier


I am using Mathematica 10 to generate a 3D point plot of a crystal lattice structure. I wanted to set the PlotTheme to "Classic", but by accident I set it to "Monochrome" instead. This turns all the points to black spheres. When I tried to reset the PlotTheme to "Classic", but the plot points remain black spheres. I have tried restarting Mathematica, turning kernel on/off , all without success. All the other PlotThemes seem to be working though.

Is this a bug? Any suggestion on how to overcome this?

edit: I am changing the question to how to obtain v9 colored spheres in v10 using ListPointPlot3D. My code is:

u1 = {0, 1, 0};
u2 = {Sqrt[3]/2, -(1/2), 0};
u3 = {0, 0, 1};
ListPointPlot3D[{
  Partition[Flatten[Table[l u1 + p u2 + q u3, {l, -3, 3}, {p, -3, 3}, {q, -3, 3}]], 3]}, 
  PlotRange -> {{-1, 1}, {-1, 1}, {-1, 1}}, 
  PlotStyle -> PointSize[0.03], PlotTheme -> "Classic"]

this produces a bunch of black spheres for me, I just want the classic v9 colored spheres :(

$\endgroup$
7
  • 1
    $\begingroup$ Can you give the code you used to cause this problem to see if others can reproduce it? $\endgroup$
    – bill s
    Commented Dec 17, 2014 at 18:46
  • $\begingroup$ Perhaps the points are supposed to be black spheres in the "Classic" plot theme? $\endgroup$
    – Michael E2
    Commented Dec 17, 2014 at 19:19
  • $\begingroup$ No, the classic theme spheres are blue and purplish spheres $\endgroup$
    – user64620
    Commented Dec 17, 2014 at 19:20
  • $\begingroup$ this is a simplified version of my code but it illustrates the problem. i have a hexagonal lattice defined by lattice vectors u1, u2, and u3 given below: u1 = {0, 1, 0}; u2 = {Sqrt[3]/2, -(1/2), 0}; u3 = {0, 0, 1}; ListPointPlot3D[ Partition[ Flatten[Table[ l u1 + p u2 + q u3, {l, -3, 3}, {p, -3, 3}, {q, -3, 3}]], 3], PlotRange -> {{-1, 1}, {-1, 1}, {-1, 1}}, PlotTheme -> "Monochrome"] this generates the lattice with all the lattice points being black spheres. But when i switch to PlotTheme->"Classic" the lattice points stay as black spheres :( I just want the classic look. $\endgroup$
    – user64620
    Commented Dec 17, 2014 at 19:21
  • $\begingroup$ @user64620 Without using "Monochrome", "Classic" produces black for me. So I see no relation between them. This produces an error: ListPointPlot3D[Partition[Flatten[Table[l u1 + p u2 + q u3, {l, -3, 3}, {p, -3, 3}, {q, -3, 3}]], 3], PlotTheme -> "Classic"]. V10.0.1, Mac OSX 10.9.5. $\endgroup$
    – Michael E2
    Commented Dec 17, 2014 at 19:28

3 Answers 3

7
$\begingroup$

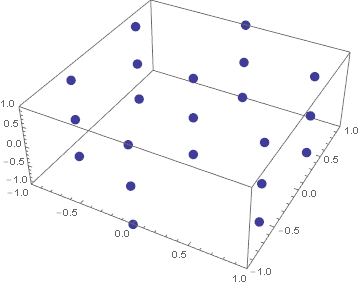
Both options PlotTheme -> None and PlotTheme -> "Classic" don't give the expected coloring for the points. However, you can set their color explicitly using PlotStyle -> Directive[PointSize[0.03], ColorData[1][1]]:

ListPointPlot3D[
  Partition[Flatten[Table[l u1 + p u2 + q u3, {l, -3, 3}, {p, -3, 3}, {q, -3, 3}]], 3], 
  PlotRange -> {{-1, 1}, {-1, 1}, {-1, 1}}, 
  PlotStyle -> Directive[PointSize[0.03], ColorData[1][1]]]

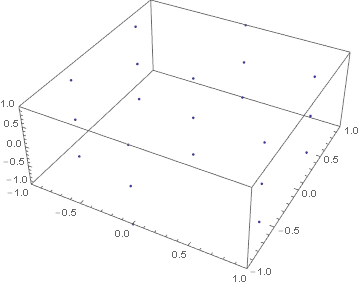
LPP3D


Additional Observation:

Setting the PlotTheme to "Classic" or None without specifying a PlotStyle:

ListPointPlot3D[
  Partition[Flatten[Table[l u1 + p u2 + q u3, {l, -3, 3}, {p, -3, 3}, {q, -3, 3}]], 3], 
  PlotRange -> {{-1, 1}, {-1, 1}, {-1, 1}}, PlotTheme -> "Classic"]

or

ListPointPlot3D[
      Partition[Flatten[Table[l u1 + p u2 + q u3, {l, -3, 3}, {p, -3, 3}, {q, -3, 3}]], 3], 
      PlotRange -> {{-1, 1}, {-1, 1}, {-1, 1}}, PlotTheme -> None]

results in an error message

MapThread::mptd: Object Automatic at position {2, 2} in MapThread[Function[{Graphics`ListPointPlot3DDump`d$,Charting`s$},If[Last[Graphics`ListPointPlot3DDump`d$]===None,<<1>>,If[Head[First[<<1>>]]===Point&&FreeQ[Last[Graphics`ListPointPlot3DDump`d$],#1],{Charting`s$,Prepend[Last[<<31>>],(Point[<<1>>]&)[<<1>>]]},{Charting`s$,ReleaseHold[(<<1>>&)/@First[<<1>>]]}]]],<<1>>] has only 0 of required 1 dimensions. >>

and no plotted points. This is not the case for all the other base themes, indicating that the behavior observed by the OP is indeed a bug in ListPointPlot3D.

$\endgroup$
1
  • $\begingroup$ nicely done! thank you! $\endgroup$
    – user64620
    Commented Dec 17, 2014 at 20:56
3
$\begingroup$

The problem seems to be the setting "DefaultPlotStyle" -> Automatic in the Method option in the plot theme:

Charting`ResolvePlotTheme["Classic", ListPointPlot3D]
(*
  {AxesStyle -> Directive[GrayLevel[0], AbsoluteThickness[0.2]], 
   BaseStyle -> Automatic, FaceGridsStyle -> Automatic, 
   LabelStyle -> {FontFamily -> "Times"}, 
   Method -> {
     <omitted>,
     "DefaultPlotStyle" -> Automatic, 
     <omitted>}}
*)

Evidently from the error message one gets from ListPointPlot3D[data, PlotTheme -> "Classic"], which indicates MapThread is called on Automatic, the setting Automatic should be or have been replaced by a List of styles. it seems like a simple bug to fix. Certainly we can do it at on the user side by replacing Automatic with the list of styles for ListPlot:

classicListPointPlot3D[data_, opts : OptionsPattern[ListPointPlot3D]] :=
  With[{defaultstyles = 
     "DefaultPlotStyle" /. (Method /. Charting`ResolvePlotTheme["Classic", ListPlot])},
   ListPointPlot3D[data, opts, 
    Charting`ResolvePlotTheme["Classic", ListPointPlot3D] /. 
     HoldPattern["DefaultPlotStyle" -> _] -> ("DefaultPlotStyle" -> defaultstyles)]
   ];

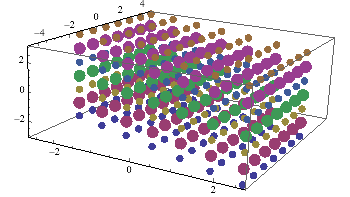
classicListPointPlot3D[
 GatherBy[
  Flatten[
   Table[l u1 + p u2 + q u3, {l, -3, 3}, {p, -3, 3}, {q, -3, 3}], 2],
  Last],
 PlotStyle -> {PointSize[0.025], PointSize[0.04]}]

Mathematica graphics

$\endgroup$
1
$\begingroup$

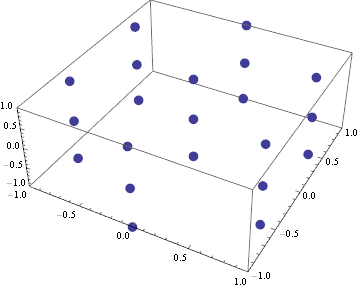
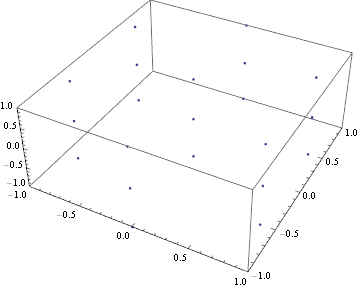
In Mathematica v10.3 this bug is fixed. Also setting the PlotTheme to "Classic" or None without specifying a PlotStyle now works as expected.

$Version

$\ $"10.3.0 for Microsoft Windows (64-bit) (October 9, 2015)"

u1 = {0, 1, 0};
u2 = {Sqrt[3]/2, -(1/2), 0};
u3 = {0, 0, 1};
ListPointPlot3D[{Partition[
   Flatten[Table[l u1 + p u2 + q u3, {l, -3, 3}, {p, -3, 3}, {q, -3, 3}]], 3]}, 
 PlotRange -> {{-1, 1}, {-1, 1}, {-1, 1}}, 
 PlotStyle -> PointSize[0.03], PlotTheme -> "Classic"]

enter image description here

ListPointPlot3D[
 Partition[
  Flatten[Table[l u1 + p u2 + q u3, {l, -3, 3}, {p, -3, 3}, {q, -3, 3}]], 3], 
 PlotRange -> {{-1, 1}, {-1, 1}, {-1, 1}}, PlotTheme -> "Classic"]

enter image description here

ListPointPlot3D[
 Partition[
  Flatten[Table[l u1 + p u2 + q u3, {l, -3, 3}, {p, -3, 3}, {q, -3, 3}]], 3], 
 PlotRange -> {{-1, 1}, {-1, 1}, {-1, 1}}, PlotTheme -> None]

enter image description here

$\endgroup$

Your Answer

By clicking “Post Your Answer”, you agree to our terms of service and acknowledge you have read our privacy policy.

Not the answer you're looking for? Browse other questions tagged or ask your own question.