1
$\begingroup$

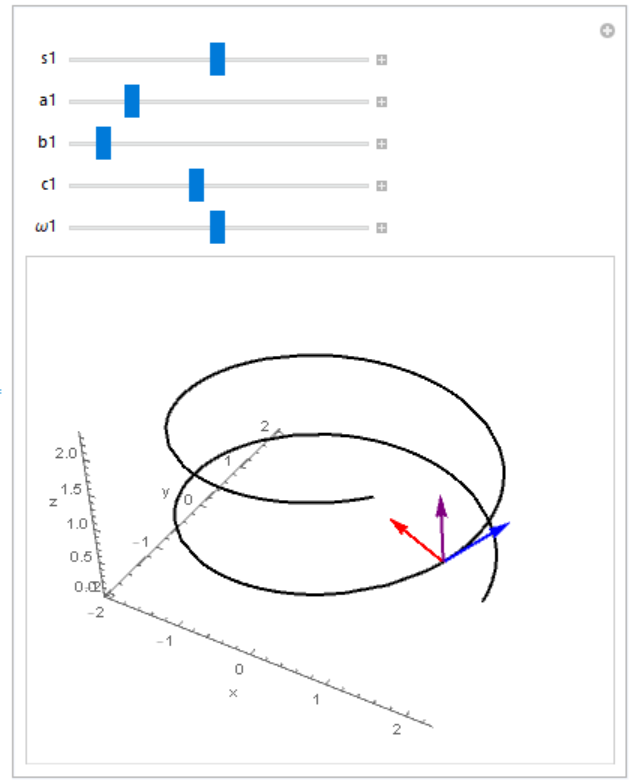
I am trying to plot a general helix with variable parameters (via sliders) and its associated FrenetSerretSystem. The helix doesn't show.

helix = {a*Cos[(\[Omega]*s)/c], a*Sin[(\[Omega]*s)/c], (b*s)/c};
basis = Last[FrenetSerretSystem[helix, s]] // Simplify;
{tangent, normal, binormal} = 
  Map[Arrow[{helix, helix + #}] &, basis];
tangent
Manipulate[
 Show[ParametricPlot3D[helix, {s, 0, 10}, PlotStyle -> {Thick, Black},
      PerformanceGoal -> "Quality",] // Evaluate, 
   Graphics3D[{Thick, Blue, Dynamic[tangent], Red, Dynamic[normal], 
     Purple, Dynamic[binormal]}],
   AxesLabel -> {"x", "y", "z"},
   AxesEdge -> {{-1, -1}, {-1, -1}, {-1, -1}},
   Boxed -> False,
   PlotRange -> All] // Evaluate, {{s, 5}, 0, 10}, {{a, 1}, 0, 
  10}, {{b, 1}, 0, 10}, {{c, 1}, 0, 10}, {{\[Omega], 5}, 0, 10},
 ContinuousAction -> True,
 SaveDefinitions -> True,
 Initialization :> ({a = 2, b = 1, c = 1, \[Omega] = 5})
 ]

If I fix the parameters it is working:

With[{a = 2, b = 1, 
       c = 1, \[Omega] = 5}, \[Beta][s_] = {a*Cos[(\[Omega]*s)/c], 
        a*Sin[(\[Omega]*s)/c], (b*s)/c}];
    basis = Last[FrenetSerretSystem[\[Beta][s], s]] // Simplify;
    {tangent, normal, binormal} = 
      Map[Arrow[{\[Beta][s], \[Beta][s] + #}] &, basis];
    pp = ParametricPlot3D[\[Beta][s], {s, 0, 10}, 
       PlotStyle -> {Thick, Black}, PerformanceGoal -> "Quality"];
    fs = Graphics3D[{Thick, Blue, tangent, Red, normal, Purple, binormal}];

    Manipulate[Show[pp, fs,
       AxesLabel -> {"x", "y", "z"},
       AxesEdge -> {{-1, -1}, {-1, -1}, {-1, -1}},
       Boxed -> False,
       PlotRange -> All
       ] // Evaluate, {{s, 2}, 0, 10},
     ContinuousAction -> True
     ]

What am I missing?

$\endgroup$

1 Answer 1

2
$\begingroup$
helix = {a*Cos[(\[Omega]*s)/c], a*Sin[(\[Omega]*s)/c], (b*s)/c};
basis = Last[FrenetSerretSystem[helix, s]] // Simplify;
{tangent, normal, binormal} = Map[Arrow[{helix, helix + #}] &, basis];

Manipulate[
 Show[ParametricPlot3D[
   helix /. {a -> a1, b -> b1, c -> c1, \[Omega] -> \[Omega]1, 
     s -> s1}, {s1, 0, 10}, PlotStyle -> {Thick, Black}, 
   PerformanceGoal -> "Quality"], 
  Graphics3D[{Thick, Blue, 
    Dynamic[tangent /. {a -> a1, b -> b1, 
       c -> c1, \[Omega] -> \[Omega]1, s -> s1}], Red, 
    Dynamic[normal /. {a -> a1, b -> b1, 
       c -> c1, \[Omega] -> \[Omega]1, s -> s1}], Purple, 
    Dynamic[binormal /. {a -> a1, b -> b1, 
       c -> c1, \[Omega] -> \[Omega]1, s -> s1}]}], 
  AxesLabel -> {"x", "y", "z"}, 
  AxesEdge -> {{-1, -1}, {-1, -1}, {-1, -1}}, Boxed -> False, 
  PlotRange -> All], {{s1, 5}, 0, 10}, {{a1, 1}, 0, 10}, {{b1, 1}, 0, 
  10}, {{c1, 1}, 0, 10}, {{\[Omega]1, 5}, 0, 10}, 
 ContinuousAction -> True, SaveDefinitions -> True, 
 Initialization :> ({a1 = 2, b1 = 1, c1 = 1, \[Omega]1 = 5})]

fig1

$\endgroup$
4
  • $\begingroup$ Wow! Thank you so much! May I ask you for a pointer in the Mathematica documentation where I possibly could have found this solution myself? I spent hours searching but didn't find it. $\endgroup$
    – Nikolaus
    Commented Nov 30, 2018 at 21:17
  • $\begingroup$ @Nikolaus I'm sorry, I did not read the documents and textbooks. It's just the experience of using 10 versions of Mathematica. $\endgroup$ Commented Nov 30, 2018 at 22:31
  • $\begingroup$ No problem, thank you so much again! $\endgroup$
    – Nikolaus
    Commented Dec 1, 2018 at 0:14
  • $\begingroup$ You're welcome! $\endgroup$ Commented Dec 1, 2018 at 0:16

Your Answer

By clicking “Post Your Answer”, you agree to our terms of service and acknowledge you have read our privacy policy.

Not the answer you're looking for? Browse other questions tagged or ask your own question.