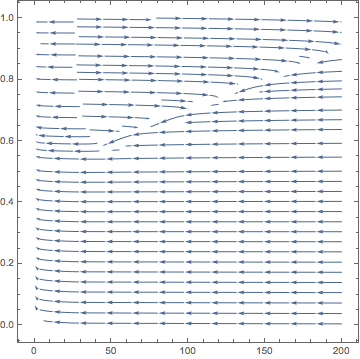
I want to picture the phase plane of the normalized system. Here I've defined only the right hand sides.
νmax = 100; gE = 5; kv = 20; u0 = 24; τD = 2000; δxD = 0.01; σ = 5;
CC = 10;
Clear[f];
f[x_?NumericQ] =Piecewise[{{0, x < 0}, {x, x > 0 && x < 1}, {1, x > 1}}];
ν[x_] = νmax f[(x - u0)/kv];
rhs1[x_, v_] = (1 - x)/τD - (δxD x ν[v])/1000;
rhs2[x_, v_] = (-v + gE ν[v] (x - 0.5))/CC;
StreamPlot[{rhs2[x, v], rhs1[x, v]}, {v, 0, 200}, {x, 0, 1}, StreamPoints -> Fine, PlotRange -> {{0, 200}, {0, 1}}]
The problem is a low resolution of StreamPlot command. It's just a single line depicted on the phase plane and, obviously, it can not say much about behaviour of the system. Here I have piecewise function, and I want to get a very detailed, that is with many lines, phase plane in each interval. But an option StreamPoints-> Fine doesn't provide me that.
I've tried to specify explicitly those points the lines of phase plane have to pass through, but it was as effective as usage the value "Fine" in the option "StreamPoints".

