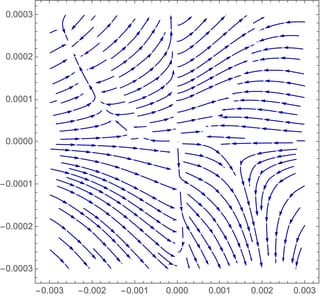
I am attempting to get a good-looking StreamPlot for the following vector field
{bl,bg}={-2.*l + (0.004772058781813607*g^3*(-0.1683035841273637 + 1.*l))/(-50193.66023321655*g*l^2 + 1.7529983163541001*^6*l^4 + g^2*(359.30244480414694 - 0.11403412344326679*l + 1.*l^2)) +
  (0.05701706172156891*g^2*(54.10831727501825 + 10502.723562681063*l + 1.*l^2))/(-50193.66023321655*g*l^2 + 1.7529983163541001*^6*l^4 + g^2*(359.30244480414694 - 0.11403412344326679*l + 1.*l^2)) +
  (0.004772285854259166*g*(g*(0.01754789181150121 - 50193.66023321655*l)*l^2 + (-45156.14178489881 - 7.011826444891847*^6*l)*l^4 +
     g^2*(-0.00012561348185679053 + 359.3024448440137*l - 0.11403447304701614*l^2 + 1.*l^3)))/
   (l^2*(-50193.66023321655*g*l^2 + 1.7529983163541001*^6*l^4 + g^2*(359.30244480414694 - 0.11403412344326679*l + 1.*l^2))),
 (g*(-150580.98069964963*g*l^2 + 3.5059966327082003*^6*l^4 + g^2*(1437.200026380605 - 0.17105118516496448*l + 2.*l^2)))/
  (-50193.66023321654*g*l^2 + 1.7529983163541001*^6*l^4 + g^2*(359.3024448041468 - 0.11403412344326676*l + 1.*l^2))}
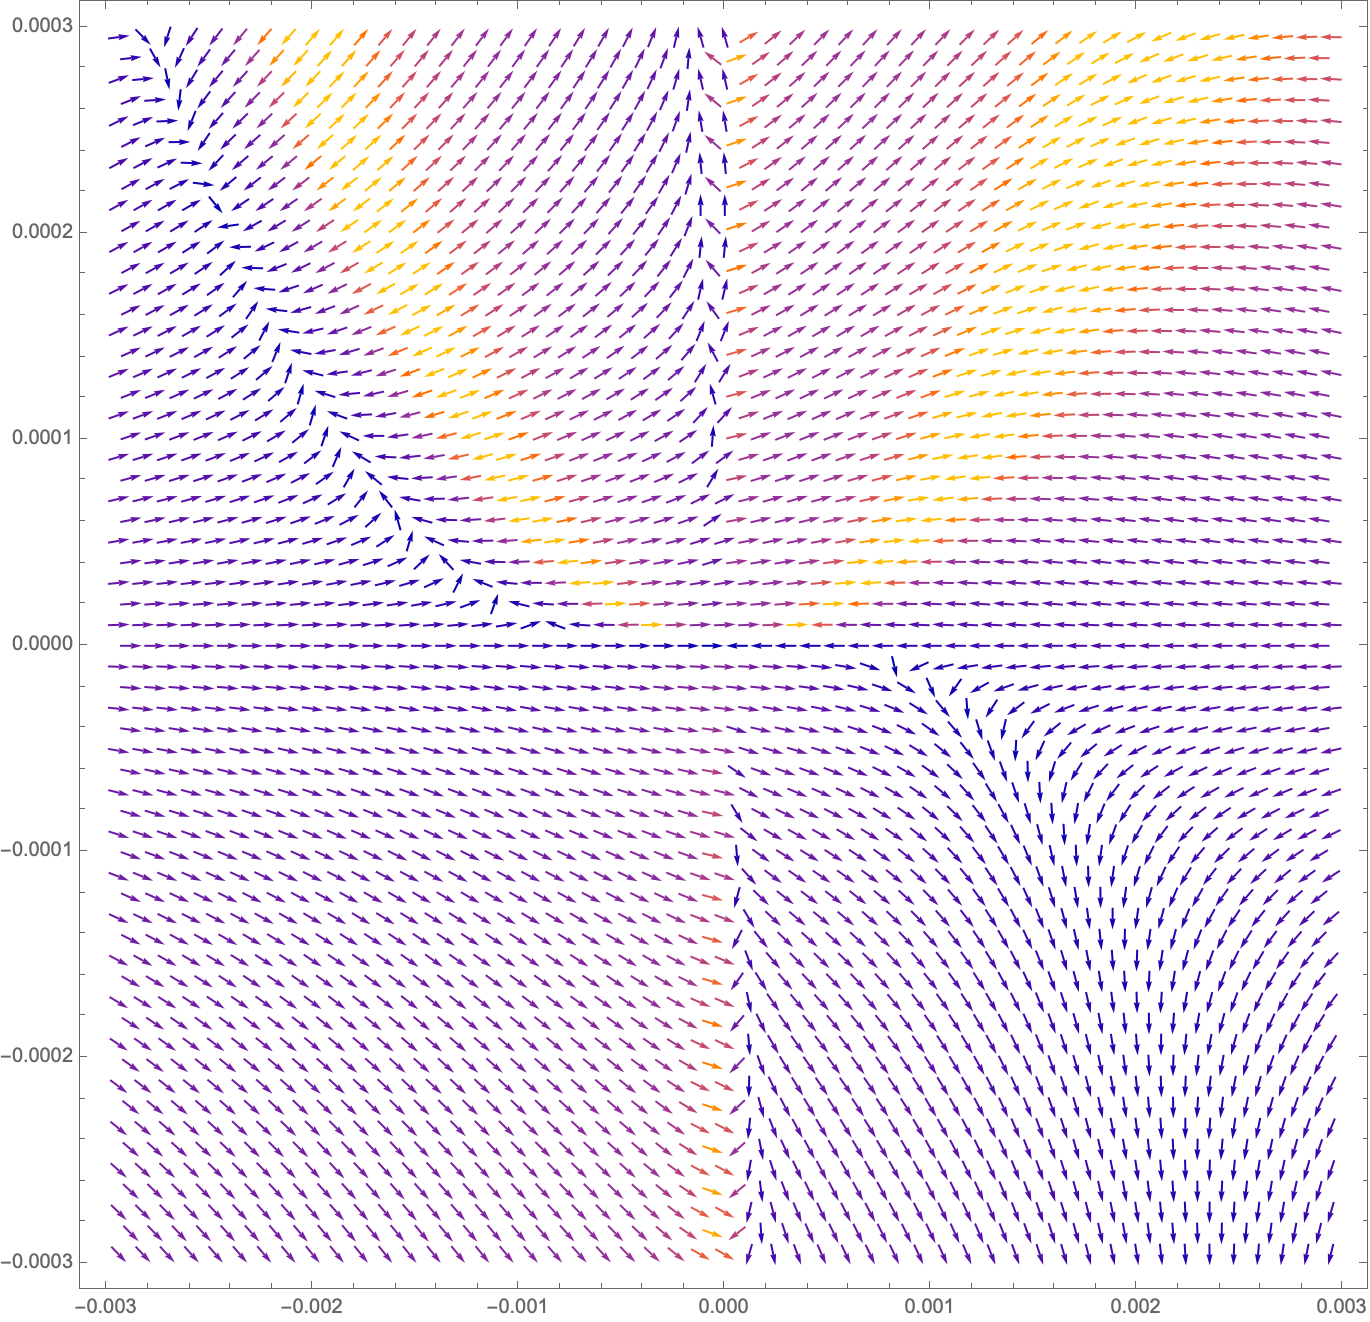
I can easily plot this with VectorPlot
VectorPlot[{bl, bg}, {l, -0.003, 0.003}, {g, -0.0003, 0.0003}, VectorPoints -> 51]
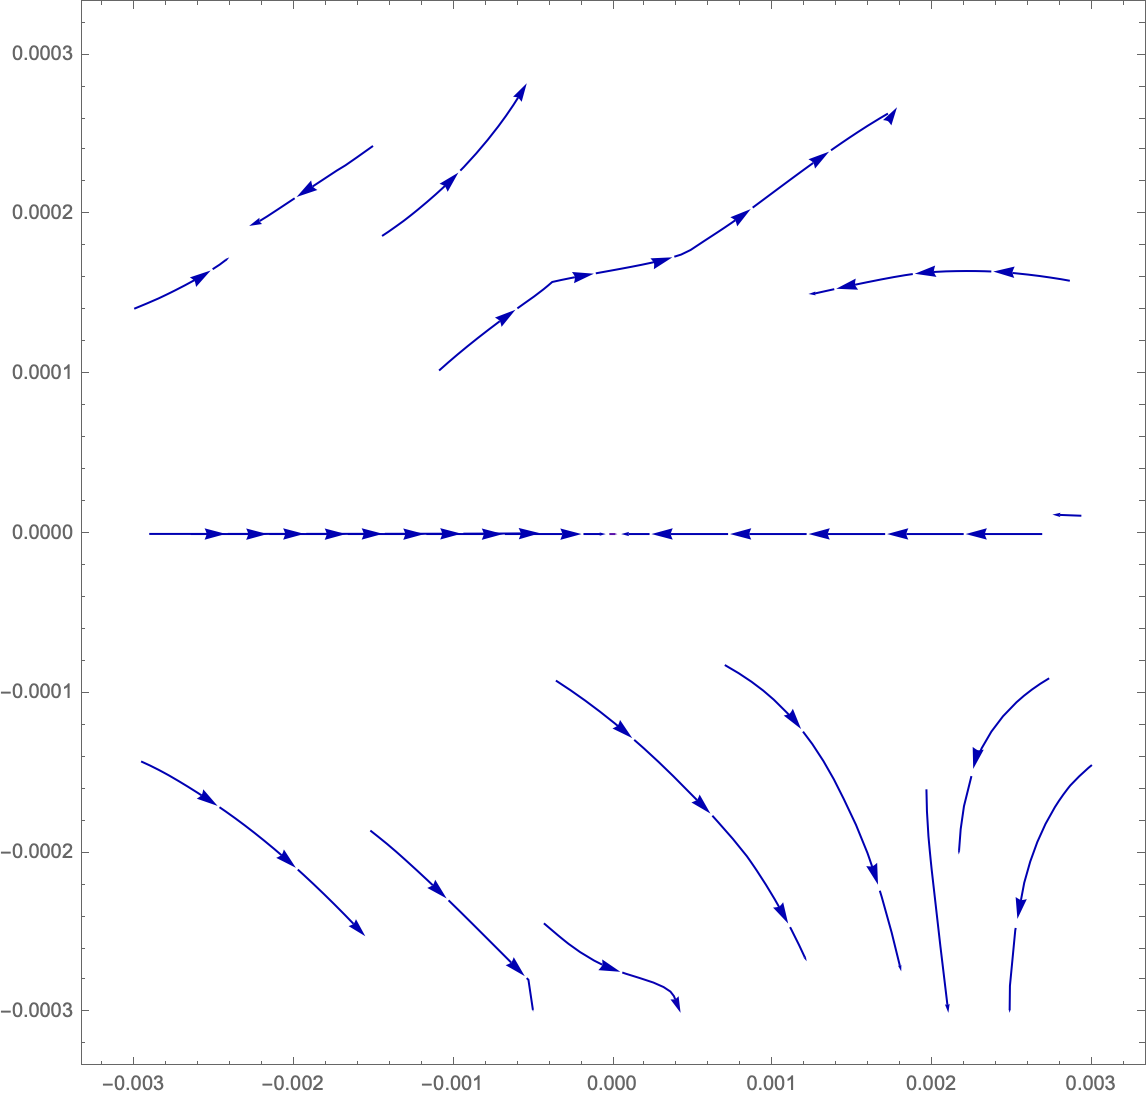
However, StreamPlot, even with a high number of StreamPoints gives me pretty bad results (in fact increasing the number of StreamPoints doesn't change the outcome)
StreamPlot[{bl, bg}, {l, -0.003, 0.003}, {g, -0.0003, 0.0003},
    StreamPoints -> 1000, PerformanceGoal -> "Quality"]
It seems to miss some sharp features in the vector field (e.g. the parabola-shaped region that can be seen in the VectorPlot), and also in the 'well-behaved' regions I cannot get seem to get decent stream lines.
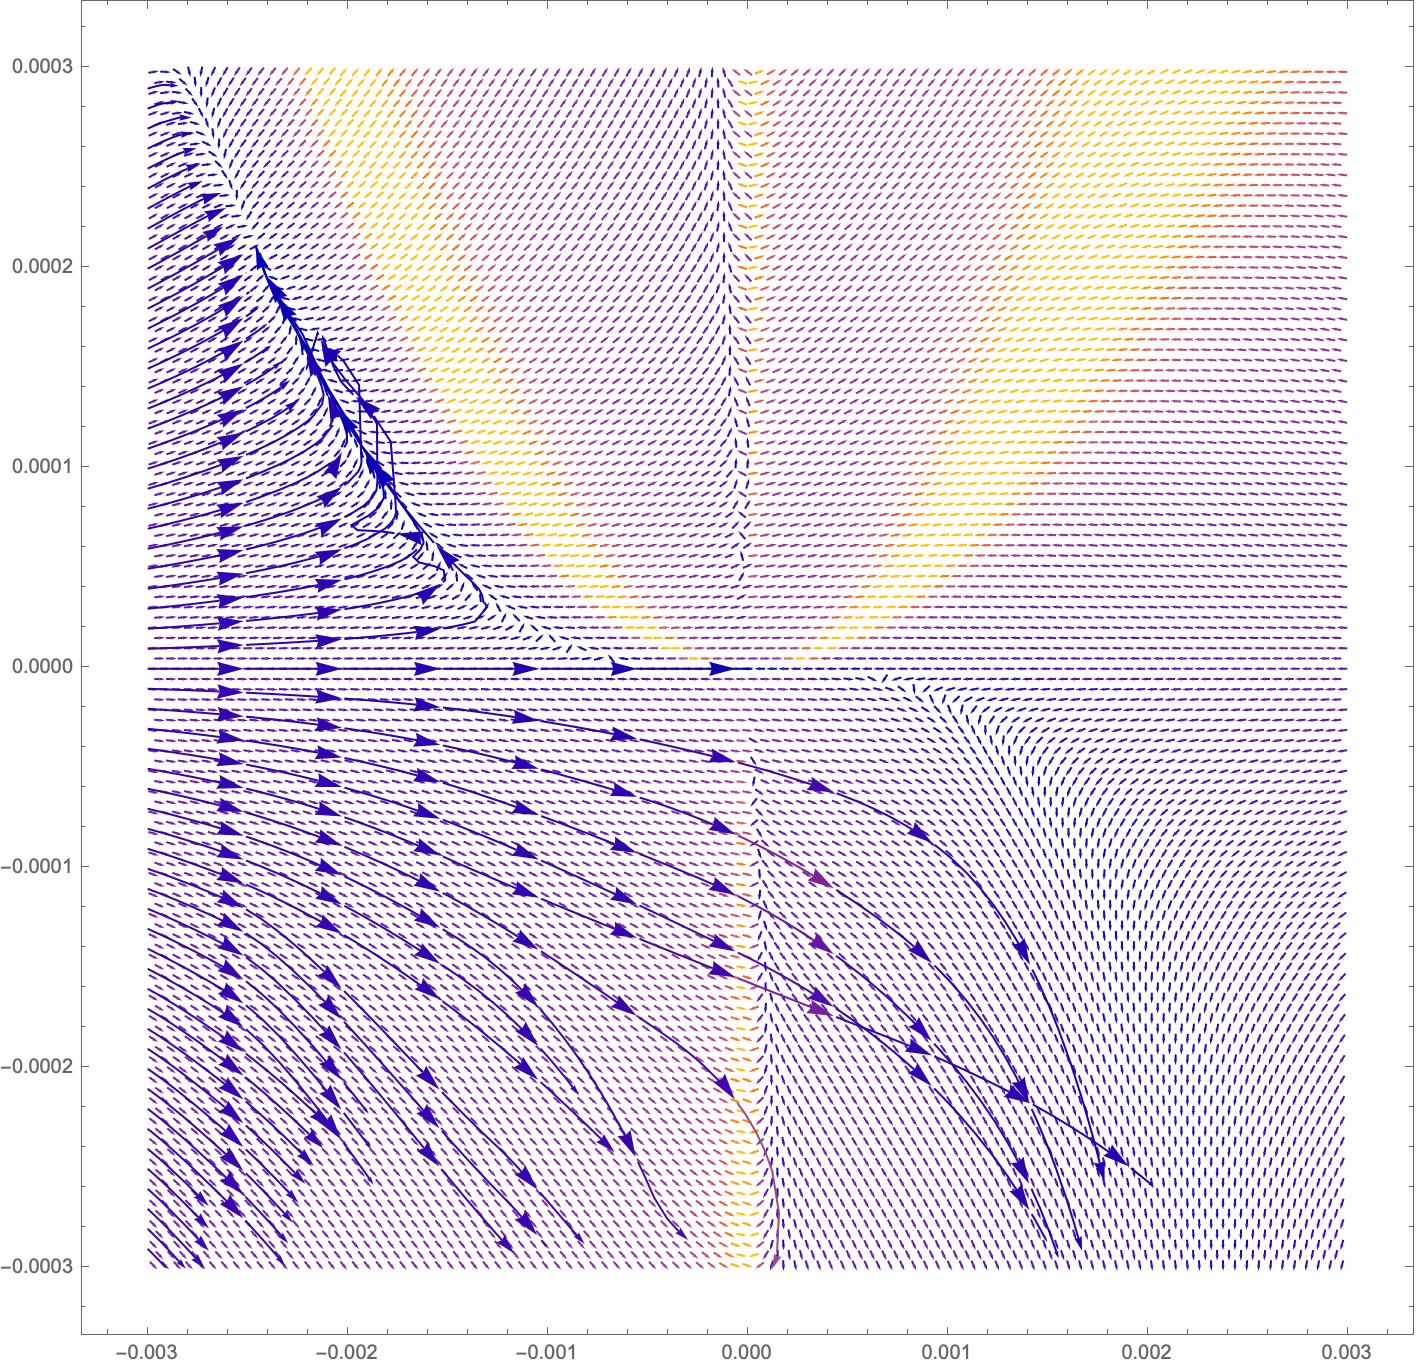
I can get better results by manually seeding stream lines, but this still leads to sub-optimal plots, where even lines in the well-behaved lower left quadrant do not seem to follow the vector field
StreamPlot[{bl, bg}, {l, -0.003, 0.003}, {g, -0.0003, 0.0003},
 StreamPoints -> {Tuples[{{-0.003}, Range[-0.0003, 0.0003, 0.00001]}],
    Automatic, .2}, PerformanceGoal -> "Quality",
 VectorPoints -> 101]
How can I improve these plots? Is there a way to reduce the step-sizes used in computing the streams (as to not miss sharp features)? And why do some lines just randomly stop, in the middle of nowhere, even though I have given the total length of the streams?


