92
$\begingroup$

I found this plot on Wikipedia:

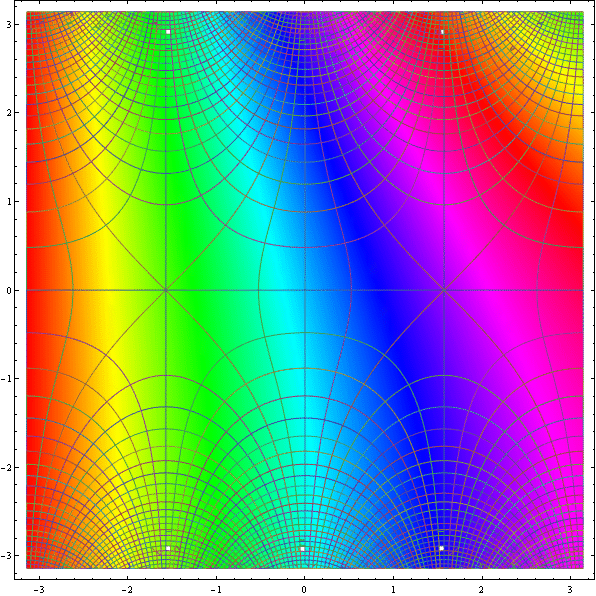
domain-colored plot of sine function

Domain coloring of $\sin(z)$ over $(-\pi,\pi)$ on $x$ and $y$ axes. Brightness indicates absolute magnitude, saturation represents imaginary and real magnitude.

Despite following the link and reading the page nothing I have tried is giving me the result shown. How should this be done?

$\endgroup$
7
  • 18
    $\begingroup$ And what have you tried? $\endgroup$
    – Ajasja
    Commented Jun 23, 2012 at 11:38
  • 16
    $\begingroup$ @Ajasja that's fair, but I ask you to cut me some slack: I've posted 395 answers to this site so I'm not unwilling to exert myself. In this case I was having a mental block so nothing I tried was worth sharing. $\endgroup$
    – Mr.Wizard
    Commented Jun 23, 2012 at 17:41
  • 24
    $\begingroup$ Is this homework? $\endgroup$ Commented Jun 24, 2012 at 4:16
  • 5
    $\begingroup$ @belisarius lol :-) (I'm assuming that's your quirky humor again.) $\endgroup$
    – Mr.Wizard
    Commented Jun 24, 2012 at 6:00
  • 3
    $\begingroup$ It's is noteworthy that Claudio Rocchini provided C/C++ code for en.wikipedia.org/wiki/File:Color_complex_plot.jpg on that same page $\endgroup$ Commented Aug 16, 2013 at 6:41

5 Answers 5

110
$\begingroup$

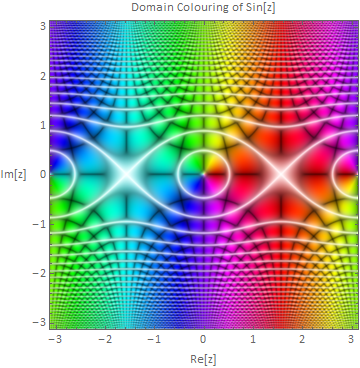
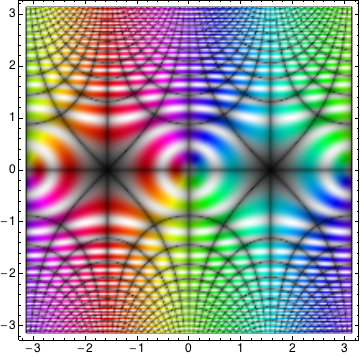
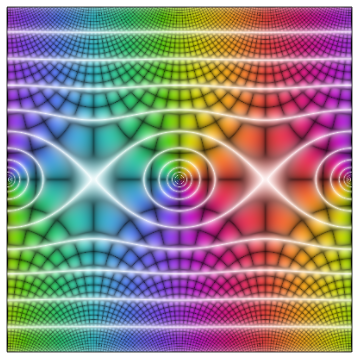
Building on Heike's ColorFunction, I came up with this:

enter image description here

The white bits are the trickiest - you need to make sure the brightness is high where the saturation is low, otherwise the black lines appear on top of the white ones.

The code is below. The functions defined are:

  • complexGrid[max,n] simply generates an $n\times n$ grid of complex numbers ranging from $-max$ to $+max$ in both axes.

  • complexHSB[Z] takes an array $Z$ of complex numbers and returns an array of $\{h,s,b\}$ values. I've tweaked the colour functions slightly. The initial $\{h,s,b\}$ values are calculated using Heike's formulas, except I don't square $s$. The brightness is then adjusted so that it is high when the saturation is low. The formula is almost the same as $b2=\max (1-s,b)$ but written in a way that makes it Listable.

  • domainImage[func,max,n] calls the previous two functions to create an image. func is the function to be plotted. The image is generated at twice the desired size and then resized back down to provide a degree of antialiasing.

  • domainPlot[func,max,n] is the end user function which embeds the
    image in a graphics frame.


complexGrid = Compile[{{max, _Real}, {n, _Integer}}, Block[{r},
    r = Range[-max, max, 2 max/(n - 1)];
    Outer[Plus, -I r, r]]];

complexHSB = Compile[{{Z, _Complex, 2}}, Block[{h, s, b, b2},
    h = Arg[Z]/(2 Pi);
    s = Abs[Sin[2 Pi Abs[Z]]];
    b = Sqrt[Sqrt[Abs[Sin[2 Pi Im[Z]] Sin[2 Pi Re[Z]]]]];
    b2 = 0.5 ((1 - s) + b + Sqrt[(1 - s - b)^2 + 0.01]);
    Transpose[{h, Sqrt[s], b2}, {3, 1, 2}]]];

domainImage[func_, max_, n_] := ImageResize[ColorConvert[
    Image[complexHSB@func@complexGrid[max, 2 n], ColorSpace -> "HSB"],
    "RGB"], n, Resampling -> "Gaussian"];

domainPlot[func_: Identity, max_: Pi, n_: 500] :=
  Graphics[{}, Frame -> True, PlotRange -> max, RotateLabel -> False, 
   FrameLabel -> {"Re[z]", "Im[z]", 
      "Domain Colouring of " <> ToString@StandardForm@func@"z"},
   BaseStyle -> {FontFamily -> "Calibri", 12},
   Prolog -> Inset[domainImage[func, max, n], {0, 0}, {Center, Center}, 2` max]];

domainPlot[Sin, Pi]

Other examples follow:

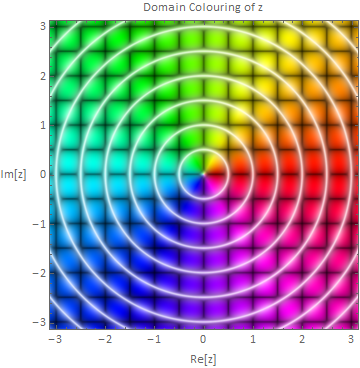
It's informative to plot the untransformed complex plane to understand what the colours indicate:

domainPlot[]

enter image description here

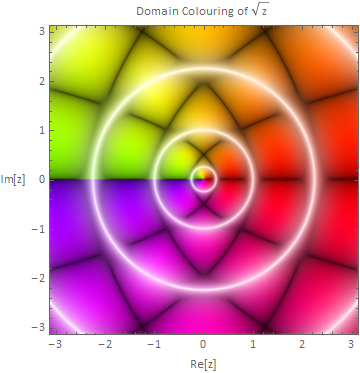
A simple example:

domainPlot[Sqrt]

enter image description here

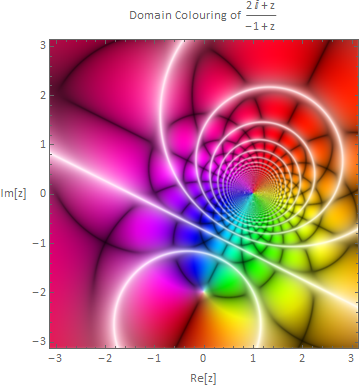
Plotting a pure function:

domainPlot[(# + 2 I)/(# - 1) &]

enter image description here

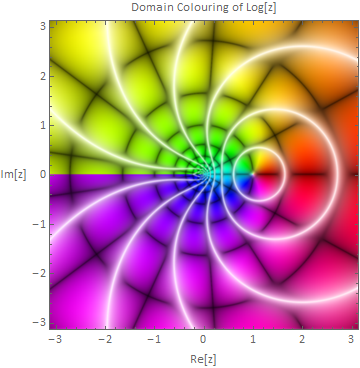
I think this one is very pretty:

domainPlot[Log]

enter image description here

$\endgroup$
22
  • 3
    $\begingroup$ +1, brilliant! In addition to just being lovely images, I love how the poles and branch cuts are clearly visible. $\endgroup$
    – rcollyer
    Commented Jun 27, 2012 at 14:56
  • 2
    $\begingroup$ Incidentally, I posted this on Facebook. The response I got: "Holy crap, mathematica keeps getting more and more awesome." $\endgroup$
    – rcollyer
    Commented Jun 27, 2012 at 15:53
  • 2
    $\begingroup$ Thanks for that, I've updated the code to work in version 7. $\endgroup$ Commented Jun 28, 2012 at 9:43
  • 2
    $\begingroup$ @rcollyer, that's great! Your friend has excellent taste. My friends would just think I was weird if I posted domain colouring plots on Facebook :-) $\endgroup$ Commented Jun 28, 2012 at 9:44
  • 1
    $\begingroup$ On Mathematica V.9, the complexGrid[] function was wrong for me, the Outer[] was not giving the expected result (it puts z with Re[z]<0 and Im[z]<0 in the upper left quadrant). See e.g. the following code: Outer[Plus, I {-1, 0, 1}, {-1, 0, 1}] // MatrixForm I replaced it with Outer[Plus, r, I r // Reverse]\[Transpose] which works for me. $\endgroup$
    – user5665
    Commented Jan 31, 2013 at 13:19
36
$\begingroup$

Not as pretty as the one in the original post, but it's getting in the right direction I think:

RegionPlot[True,
 {x, -Pi, Pi}, {y, -Pi, Pi},
 ColorFunction -> (Hue[Rescale[Arg[Sin[#1 + I #2]], {-Pi, Pi}],
     Sin[2 Pi Abs[Sin[#1 + I #2]]]^2,
     Abs@(Sin[Pi Re[Sin[#1 + I #2]]] Sin[Pi Im[Sin[#1 + I #2]]])^(1/
        4), 1] &),
 ColorFunctionScaling -> False, PlotPoints -> 200]

Mathematica graphics

It seems that the hue of the colour function is a function of Arg[Sin[z]], saturation is a function of Abs[Sin[z]] and the brightness is related to Re[Sin[z]] and Im[Sin[z]].

$\endgroup$
2
  • $\begingroup$ +1 Very close. What did you wanted to say about the brightness? $\endgroup$
    – Matariki
    Commented Jun 23, 2012 at 12:09
  • $\begingroup$ ...and if you use the color scheme in Thaller's package along with Heike's idea, you get this, whose coloring is a wee bit closer to the one in the OP. $\endgroup$ Commented Jun 23, 2012 at 12:28
24
$\begingroup$

This is a good way :

DensityPlot[ Rescale[ Arg[Sin[-x - I y]], {-Pi, Pi}], {x, -Pi, Pi}, {y, -Pi, Pi}, 
             MeshFunctions -> Function @@@ {{{x, y, z}, Re[Sin[x + I y]]}, 
                                            {{x, y, z}, Im[Sin[x + I y]]},
                                            {{x, y, z}, Abs[Sin[x + I y]]}}, 
             MeshStyle -> {Directive[Opacity[0.8], Thickness[0.001]], 
                           Directive[Opacity[0.7], Thickness[0.001]], 
                           Directive[White, Opacity[0.3], Thickness[0.006]]}, 
             ColorFunction -> Hue, Mesh -> 50, Exclusions -> None, PlotPoints -> 100]

enter image description here

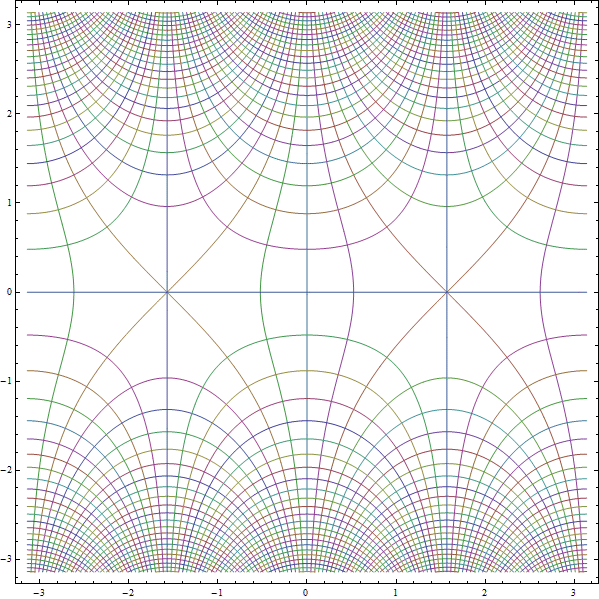
Another ways to tackle the problem, which apprears promising.

ContourPlot[ Evaluate @ {Table[Re @ Sin[x + I y] == 1/2 k, {k, -25, 25}], 
                         Table[Im @ Sin[x + I y] == 1/2 k, {k, -25, 25}]}, 
             {x, -Pi, Pi}, {y, -Pi, Pi}, PlotPoints -> 100, MaxRecursion -> 5]

enter image description here

and

RegionPlot[ Evaluate @ {Table[1/2 (k + 1) > Re @ Sin[x + I y] > 1/2 k, {k, -25, 25}],
                        Table[1/2 (k + 1) > Im @ Sin[x + I y] > 1/2 k, {k, -25, 25}]},
            {x, -Pi, Pi}, {y, -Pi, Pi}, PlotPoints -> 50, MaxRecursion -> 4, 
            ColorFunction -> Function[{x, y}, Hue[Re@Sin[x + I y]]]]

enter image description here

These plots seem to be good points for further playing around to get better solutions.

$\endgroup$
23
$\begingroup$

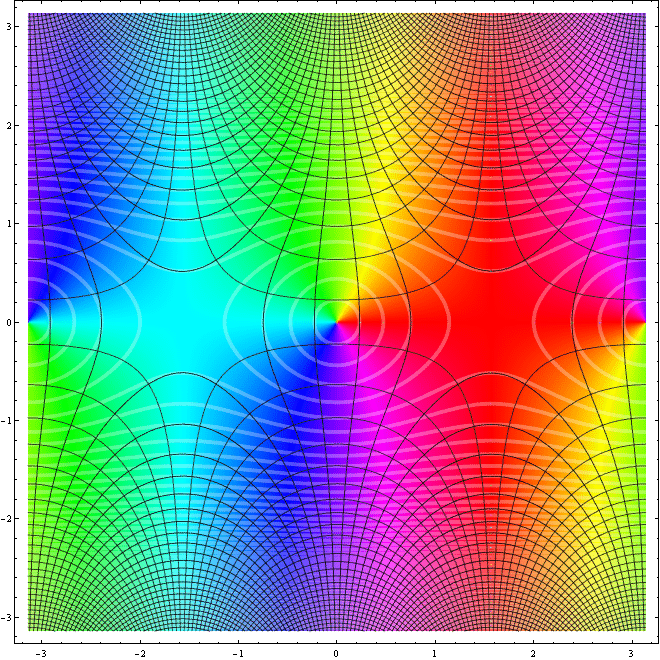
I already mentioned Bernd Thaller's package Graphics`ComplexPlot` in the comments; if one blends the ideas from Artes's and Heike's answers, and then use the function $ComplexToColorMap[] from Thaller's package (I won't include it here; again, see the package for that), we get this:
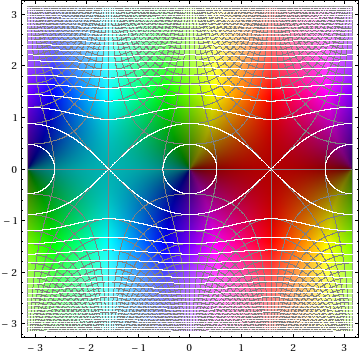
domain-colored plot

Needs["Graphics`ComplexPlot`"] (* Thaller's package; get it yourself *)

f1 = RegionPlot[True, {x, -Pi, Pi}, {y, -Pi, Pi}, 
 ColorFunction -> ($ComplexToColorMap[Abs[Sin[#1 + I #2]], 
     Arg[Sin[#1 + I #2]], {Pi, 1/10, 1, 1/10, 1}] &), 
 ColorFunctionScaling -> False, PlotPoints -> 200];

f2 = ContourPlot[
 Evaluate@{Table[Re@Sin[x + I y] == 1/2 k, {k, -25, 25}], 
   Table[Im@Sin[x + I y] == 1/2 k, {k, -25, 25}]}, {x, -Pi, 
  Pi}, {y, -Pi, Pi}, PlotPoints -> 100, ContourStyle -> Gray];

f3 = ContourPlot[
 Evaluate@Table[Abs@Sin[x + I y] == 1/2 k, {k, -25, 25}], {x, -Pi, 
  Pi}, {y, -Pi, Pi}, PlotPoints -> 100, ContourStyle -> White, 
 MaxRecursion -> 5];

Show[f1, f2, f3]

The $ComplexToColorMap[] function could probably be optimized a fair bit for new Mathematica, but I won't get into that for now. One might also consider tweaking the Opacity[] of the contour lines for the absolute value as well, but I'll leave that as an experiment for the reader.


Another thing you can try:

RegionPlot[True, {x, -Pi, Pi}, {y, -Pi, Pi}, 
 ColorFunction -> ($ComplexToColorMap[Abs[Sin[#1 + I #2]], 
     Arg[Sin[#1 + I #2]], {Pi, 1/50, 1, 1/50, 1}] &), 
 ColorFunctionScaling -> False, Mesh -> 51, 
 MeshFunctions -> {Re[Sin[#1 + I #2]] &, Im[Sin[#1 + I #2]] &}, 
 MeshStyle -> Gray, PlotPoints -> 95]
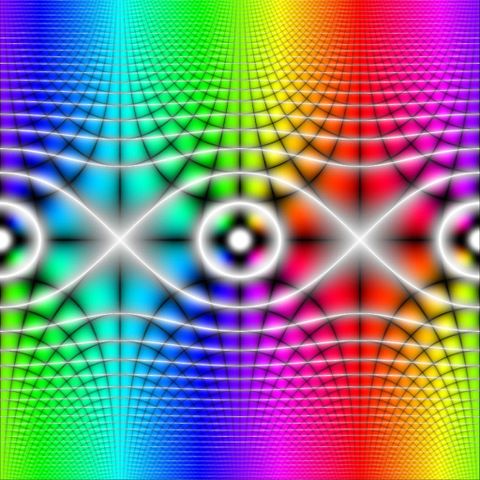
$\endgroup$
17
$\begingroup$

With Mathematica 12.0, there's now a ComplexPlot function that replaces user made solutions. As with other Plot functions, it allows us to specify a ColorFunction option to manipulate how to color the plot. This particular coloring is implemented natively in the "CyclicReImLogAbs" option.

So the modern equivalent is

ComplexPlot[Sin[z], {z, -Pi - Pi I, Pi + Pi I}, 
 ColorFunction -> "CyclicReImLogAbs", Frame -> False]

Plot Result

$\endgroup$
1
  • 5
    $\begingroup$ complements user made solutions* $\endgroup$
    – C. E.
    Commented Apr 16, 2019 at 20:47

Your Answer

By clicking “Post Your Answer”, you agree to our terms of service and acknowledge you have read our privacy policy.

Not the answer you're looking for? Browse other questions tagged or ask your own question.