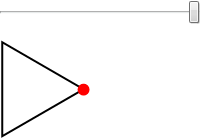
How can I animate a point moving on a triangle's sides?
I can generate a triangle and point, but I have no idea how to define point movement.
I'm guessing that I have to use $\sin$ and $\cos$ in coordinates, but I can't find a way to define the triangle in this way.
Can someone help me a bit with that?
7 Answers
If you interpret your geometric shape as a NURBS of degree 1 (linear), you can proceed with the following, extremely simple code:
pts = {{0, 0}, {1, 1}, {0.5, 1.5}}; (* just an example *)
s = BSplineFunction[pts, SplineClosed -> True, SplineDegree -> 1];
Animate[ParametricPlot[s[t], {t, 0, 1}, Epilog :> {Red, PointSize[Large], Point[s[t]]}], {t, 0., 1.}]
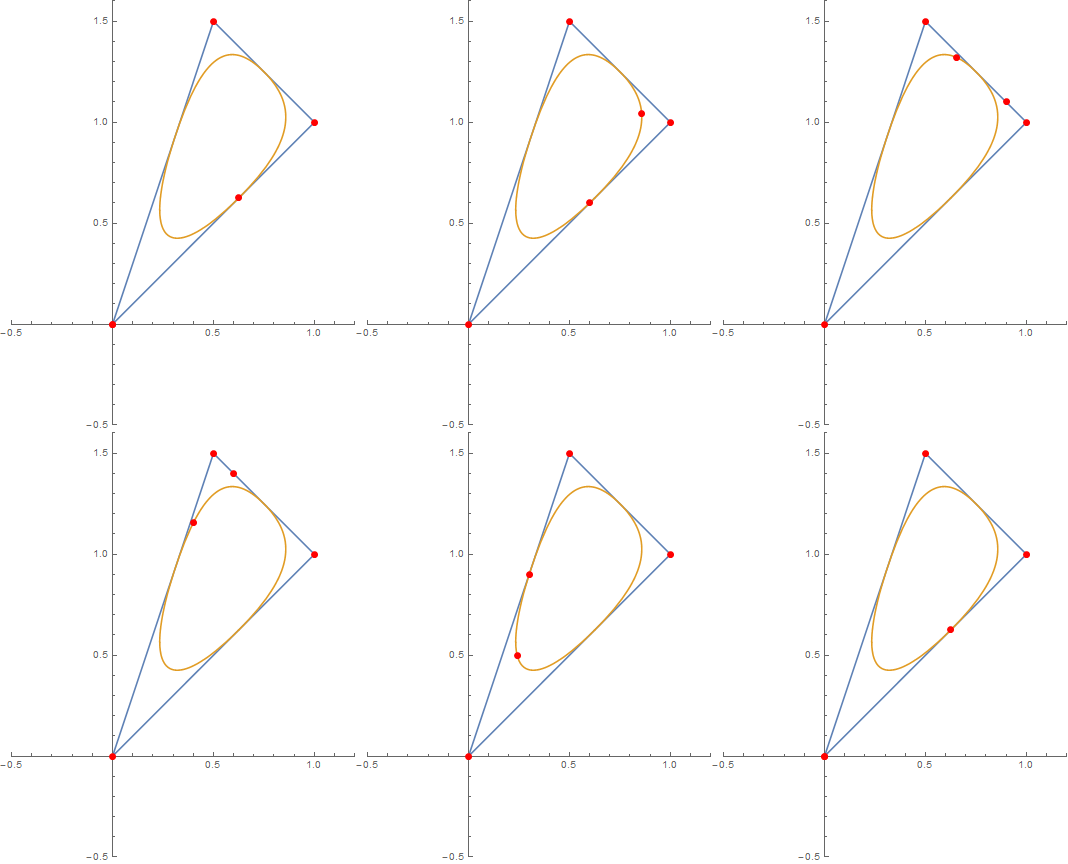
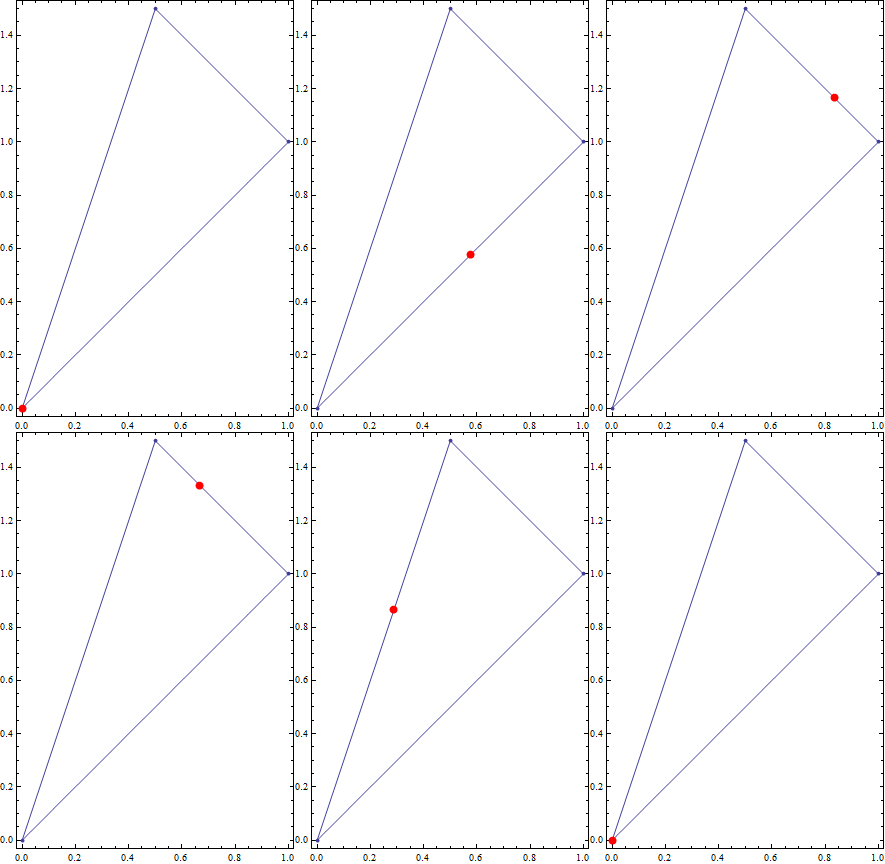
This yields the triangular (outer) graph of the following display:
Just replace Animate
by Manipulate
to give the user control over the point.
Note This is a rather general approach applicable in wide areas, since you can vary your control points as well as the spline degree, but the BSplineFunction
will always yield the curve between arguments 0 and 1. In essence, you can display quite every geometric shape using this approach. For more complex ones, some adjustment to B-spline weights will be necessary, though.
The inner of those curves result from the same control points as before, but degree 2 and weights explicitly given as SplineWeights -> {.1, 1, 1}
. Just exchange the s
-line above with this one:
s = BSplineFunction[pts, SplineClosed -> True, SplineDegree -> 2, SplineWeights -> {.1, 1, 1}];
I hope this might be of some help to you.
-
$\begingroup$ Simon, would you consider using a variation of your user name? We have a member of three years using the same name, and though he isn't as active recently it still confuses me when I see you post or comment. (This is merely a suggestion; you are not required to take action.) $\endgroup$ Commented Jan 25, 2015 at 0:33
-
$\begingroup$ Simon might be a rather common user name, I take it. Problem is: I had some problems with my Stackexchange account already, up to the point of having had to contact support for help... I will see what I can do, however, without messing up my account once again. Did I mention, how inexplicably unintuitive the Stackexchange account management is? ;) $\endgroup$– JinxedCommented Jan 25, 2015 at 1:14
-
$\begingroup$ @Mr.Wizard: I tried, but Stackexchange won't let me: I will have to wait until some time in February. Maybe you will have become acquainted to my user name until then. Either way: I can't change anything for the moment. :| $\endgroup$– JinxedCommented Jan 25, 2015 at 1:20
-
1$\begingroup$ I second @Mr.Wizard because your contributions to the site are very well received. It wouldn't matter if you were the standard "novice new user type", but you aren't. And it's a lame to have that kind of confusion among two good site citizens. Please don't forget to try changing you user name once the site allows you. $\endgroup$ Commented Jan 25, 2015 at 3:20
-
$\begingroup$ Simon, as a community elected moderator I believe I am able to change your user name. If you tell me what you would like I shall attempt it. $\endgroup$ Commented Jan 25, 2015 at 3:45
Using RegionNearest
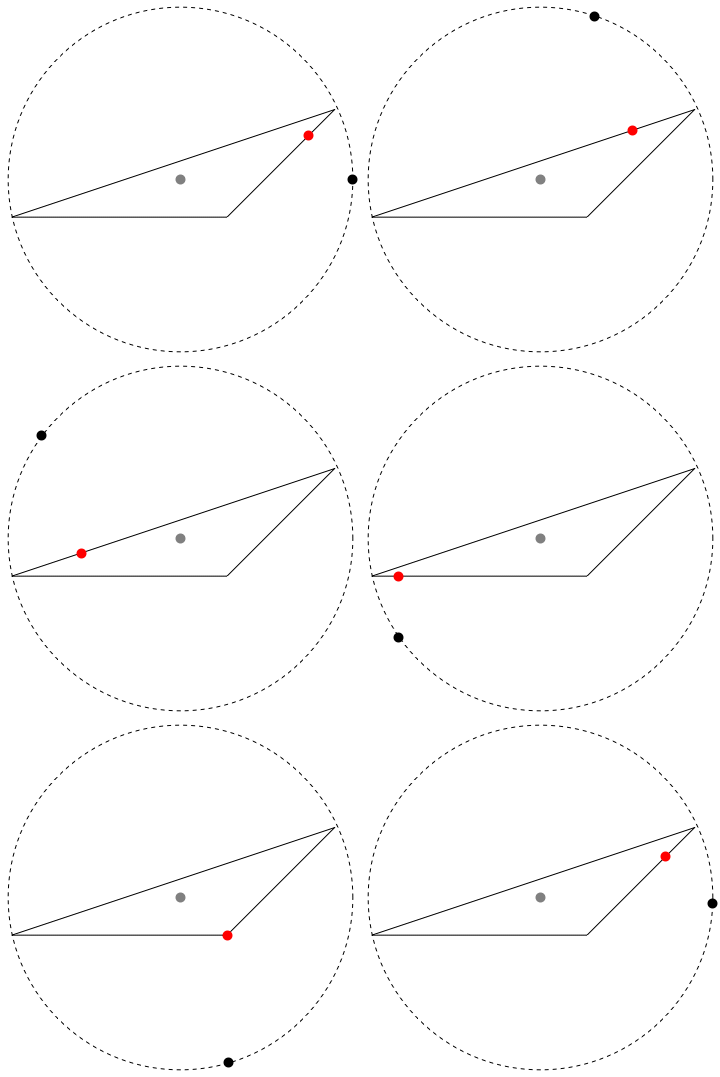
This approach should work regardless of whether the triangle is filled or not. Here, we will represent the triangle unfilled, i.e. as a one-dimensional region, r1
, a line, embedded in a plane.
r1 = Line[{{0, 0}, {3, 1}, {2, 0}, {0, 0}}];
RegionDimension[r1]
RegionEmbeddingDimension[r1]
1
2
Get the radius of a circle, with the triangle centroid as center, that intersects the farthest vertex of the triangle.
c = RegionCentroid[r1]; (* the gray point *)
radius = Max[EuclideanDistance[c, #] & /@ {{0, 0}, {3, 1}, {2, 0}}];
Animate a black point going around the circle.
And display a (red) point on the triangle that is currently nearest to the black point on the circle.
Animator[Dynamic[n], {0, N[2 Pi], .01}]
Graphics[{r1, AbsolutePointSize[10],
Gray, Point[c],
Black, Dynamic@ Point[d = radius {Cos[n], Sin[n]} + c],
{Red, Dynamic@Point[RegionNearest[r1, d]]},
{Dashed, Circle[c, radius]}}]
-
4$\begingroup$ Unusual in both method and result. +1 $\endgroup$ Commented Jan 25, 2015 at 0:35
Thanks to kguler, I now know there is something like: LineScaledCoordinate
.
vertices = Table[{Cos[i], Sin[i]}, {i, 0, 2 Pi, 2 Pi/3.}];
Needs["GraphUtilities`"]
Slider[Dynamic@t]
Graphics[{
EdgeForm @ Thick, FaceForm @ None, Polygon @ vertices
,
AbsolutePointSize @ 12, Red, Dynamic[Point[LineScaledCoordinate[vertices, t]]]
}
]
Just in case you can't load GraphUtilities`
, use Interpolation
:
f = Interpolation[Table[{{i}, vertices[[i]]}, {i, Length@vertices}],
InterpolationOrder -> 1]
Slider[Dynamic @ t, {1, 4}]
Graphics[{
EdgeForm@Thick, FaceForm@None, Polygon@vertices
,
AbsolutePointSize@12, Red, Dynamic[Point[f[t]]]
}]
This method is different because each edge has parametric length of 1. If you want uniform "velocity" then you have to take care of {i}
in Table
.
e = {{0, 0}, {1, 1}, {5.5, 1.5}, {0, 0}}; (*triangle vertices*)
(*point position as a function of time*)
p[t_, e_] := Piecewise[{
{(1 - t)*e[[1]] + t*e[[2]], 0 <= t <= 1},
{(1 - (t - 1))*e[[2]] + (t - 1)*e[[3]], 1 < t <= 2},
{(1 - (t - 2))*e[[3]] + (t - 2)*e[[1]], 2 < t <= 3}
}];
(*animation*)
Animate[
Show[
Graphics[Line[e]],
Graphics[{Red, PointSize[Large], Point[p[t, e]]}]
]
, {t, 0, 3}
]
EDIT (Make the point move at constant speed)
Length of triangle edges:
d = EuclideanDistance[#[[1]], #[[2]]] & /@ Partition[e, 2, 1]
Modified p
function so that the point moves at a normalized speed of d[[1]]
(i.e., move along the first edge in time equal to $1$)
pver2[t_, e_] := Piecewise[{
{(1 - t)*e[[1]] + t*e[[2]], 0 <= t <= 1},
{(1 - (t - 1)/(d[[2]]/d[[1]]))*e[[2]] + (t - 1)*
e[[3]]/(d[[2]]/d[[1]]), 1 < t <= 1 + d[[2]]/d[[1]]},
{(1 - (t - (1 + d[[2]]/d[[1]]))/(d[[3]]/d[[1]]))*
e[[3]] + (t - (1 + d[[2]]/d[[1]]))*e[[1]]/(d[[3]]/d[[1]]),
1 + d[[2]]/d[[1]] < t <= 1 + d[[2]]/d[[1]] + d[[3]]/d[[1]]}}];
Animation:
Animate[Show[Graphics[Line[e]],
Graphics[{Red, PointSize[Large], Point[pver2[t, e]]}]], {t, 0,
1 + d[[2]]/d[[1]] + d[[3]]/d[[1]]}]
-
1$\begingroup$ Should
e
be modified to{{0, 0}, {1, 1}, {0.5, 1.5}, {0, 0}}
to close the triangle? $\endgroup$ Commented Jan 24, 2015 at 18:49 -
$\begingroup$ @bbgodfrey Indeed, thanks for noticing $\endgroup$– SteliosCommented Jan 24, 2015 at 18:50
-
$\begingroup$ Very simple and clean solution. Is't there a way to make a point move in same speed on all sides? I know that I can adjust t param to slow it down or make it move faster, but it will still change speed on sides. $\endgroup$– DcortezCommented Jan 25, 2015 at 13:14
-
$\begingroup$ @Dcortez Please see edited answer for an (probably not elegant) implementation of the constant speed animation $\endgroup$– SteliosCommented Jan 25, 2015 at 15:28
-
$\begingroup$ Maybe not cleanest but working. Thank you very much for help. $\endgroup$– DcortezCommented Jan 25, 2015 at 15:46
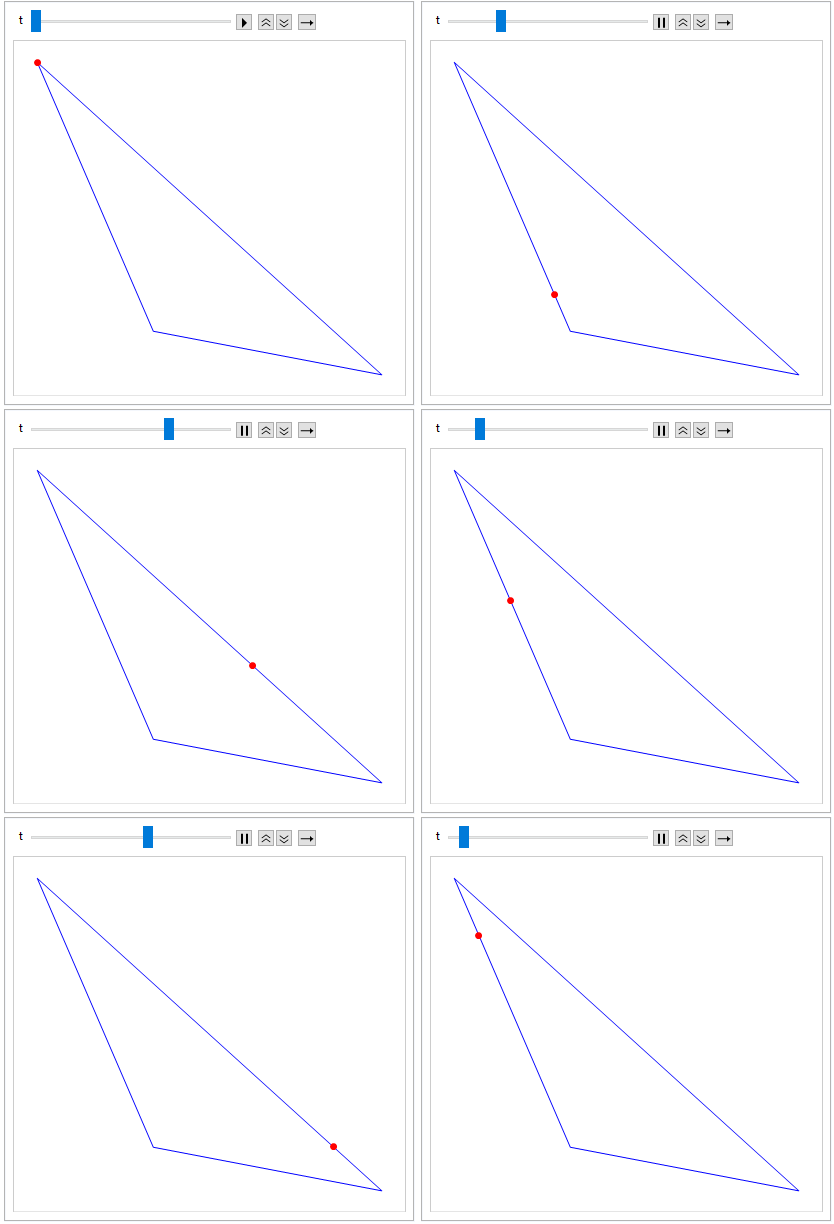
Here is my modest attempt, based on a formula given in this math.SE answer, with a few affine transformations thrown in:
triangle[pts_?MatrixQ, t_] :=
AffineTransform[{Transpose[{{2, -1, -1}/3, {0, 1, -1}/Sqrt[3]}.pts], Mean[pts]}][
Sec[t - π (2 Floor[3 t/(2 π)] + 1)/3] {Cos[t], Sin[t]}/2]
pts = {{0, 0}, {1, 1}, {1, 3}/2};
mt[t_] = triangle[pts, t];
tpic = ParametricPlot[mt[t], {t, 0, 2 π}, Frame -> True];
Animate[Show[tpic,
Epilog -> {{Directive[ColorData[1, 1], AbsolutePointSize[4]], Point[pts]},
{Directive[Red, AbsolutePointSize[8]], Point[mt[u]]}}],
{u, 0, 2 π, π/12}]
Manipulate[
Graphics[{
Line[p[[{1, 2, 3, 1}]]],
PointSize@Large, Red,
Point[With[{f = Floor[i], t = FractionalPart[i]}, {1 - t, t}.p[[Mod[{f, f + 1}, 3, 1]]]]]
}],
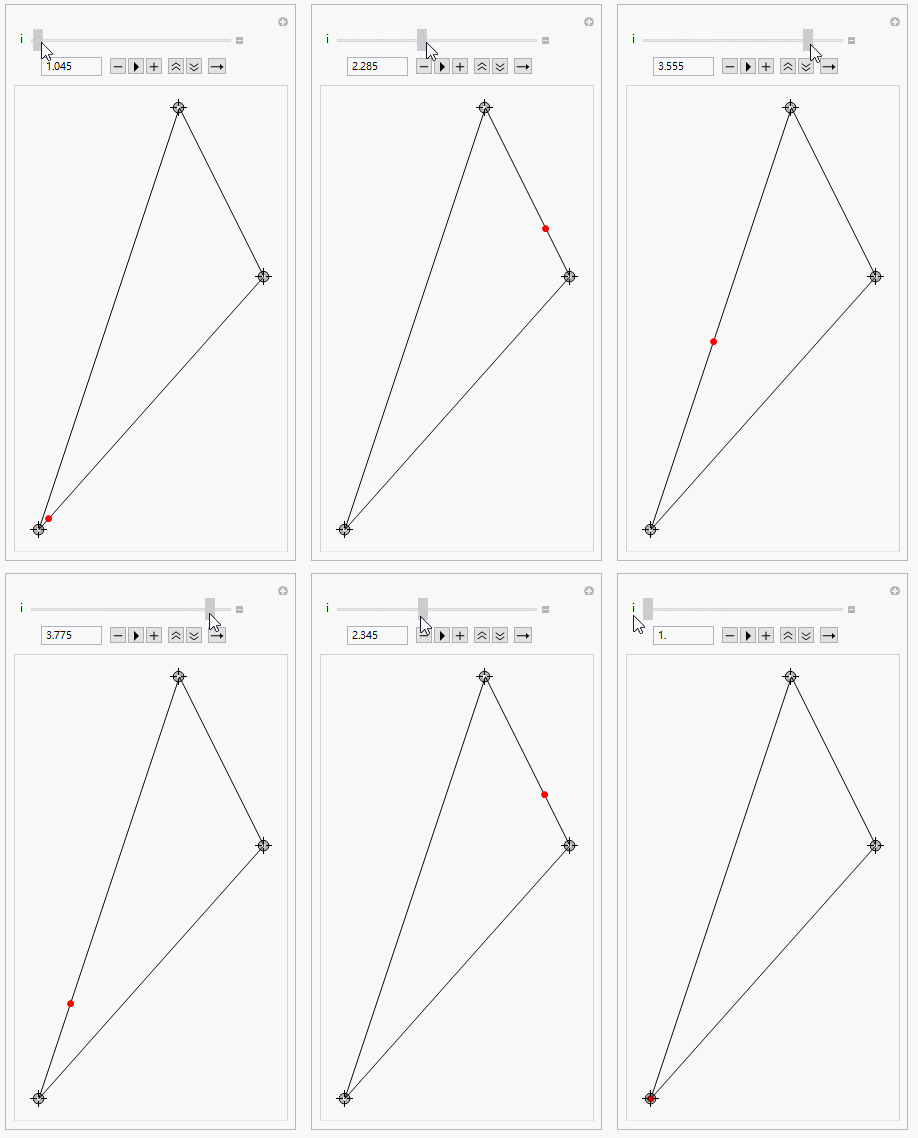
{{p, {{0, 0}, {0.8, 0.9}, {0.5, 1.5}}}, Locator}, {i, 1, 4}]
It's also easy to generalize to polygons.
SeedRandom[77]
coords = Append[#, First@#] &@RandomReal[1, {3, 2}];
Arrowheads
+ Clock
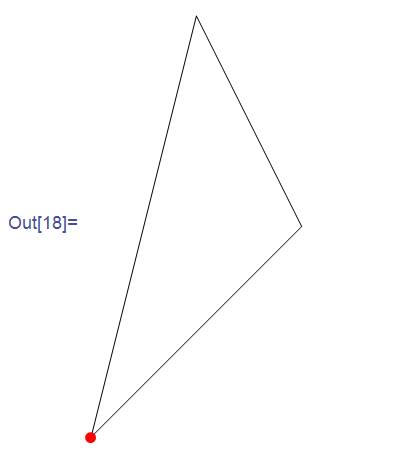
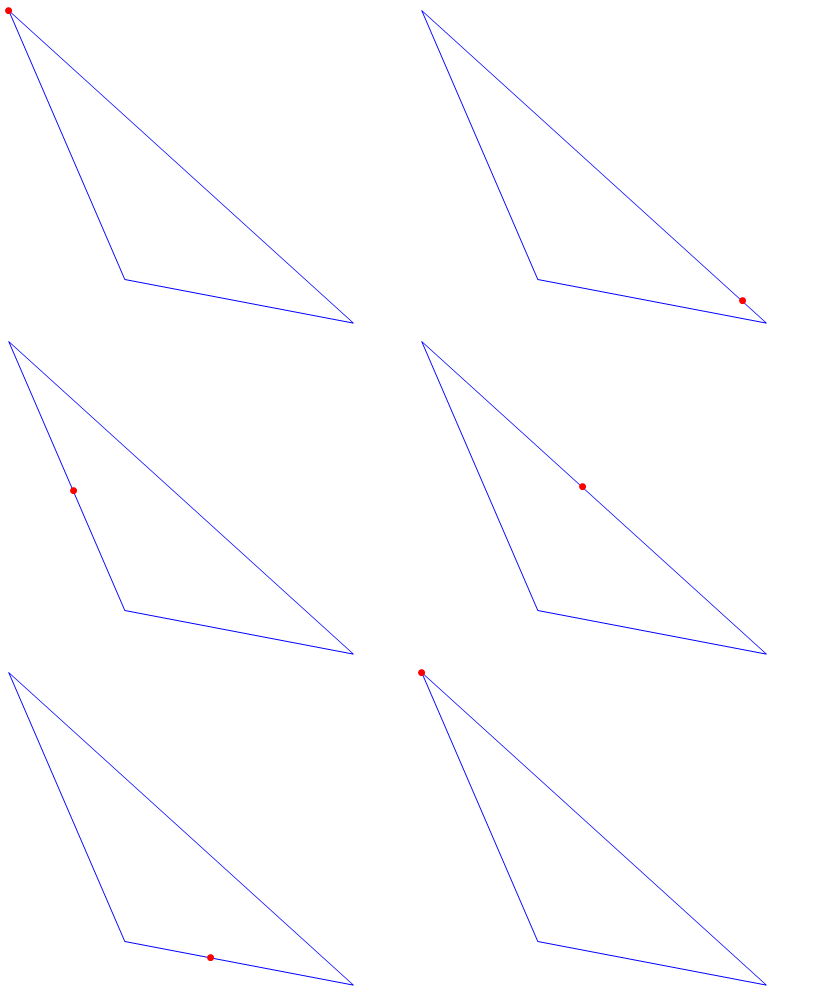
Dynamic[Graphics[{Arrowheads[{{.05, Clock[{0, 1}, 5, 3]}}],
Blue, Arrow @ coords}, Axes -> False]]
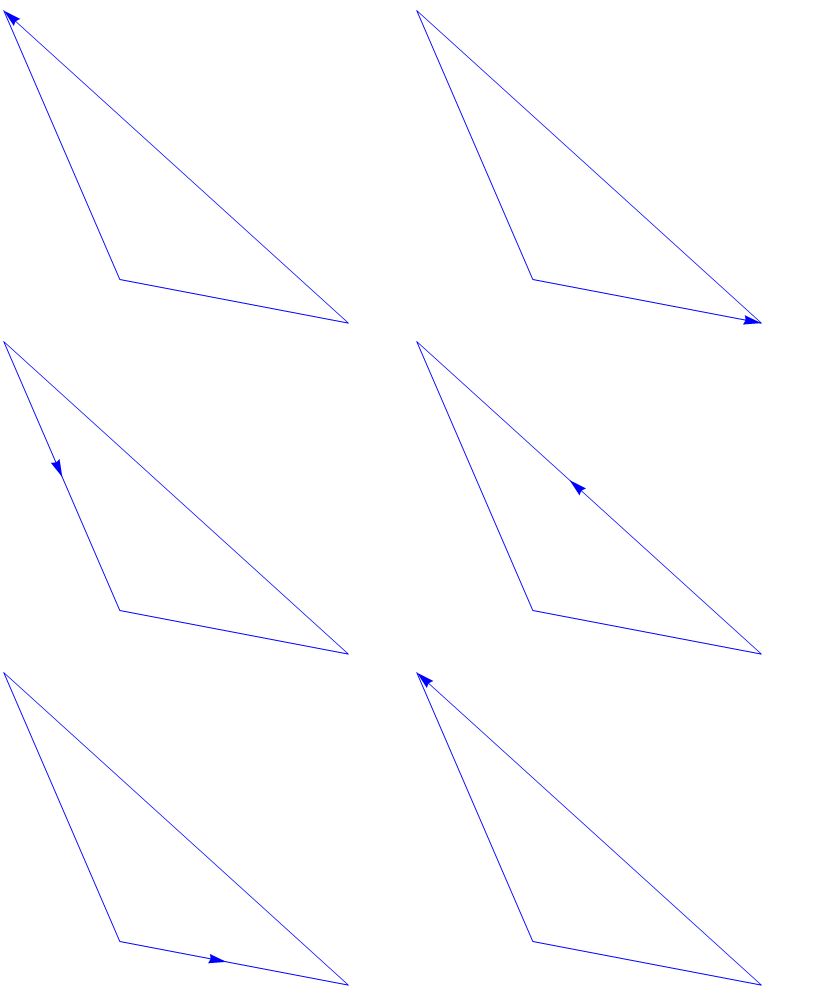
With a custom arrowhead:
pnt = Graphics[{Red, PointSize[Large], Point[{0, 0}]}];
Dynamic[Graphics[{Arrowheads[{{.05, Clock[{0, 1}, 5, 3], pnt}}],
Blue, Arrow @ coords}, Axes -> False]]
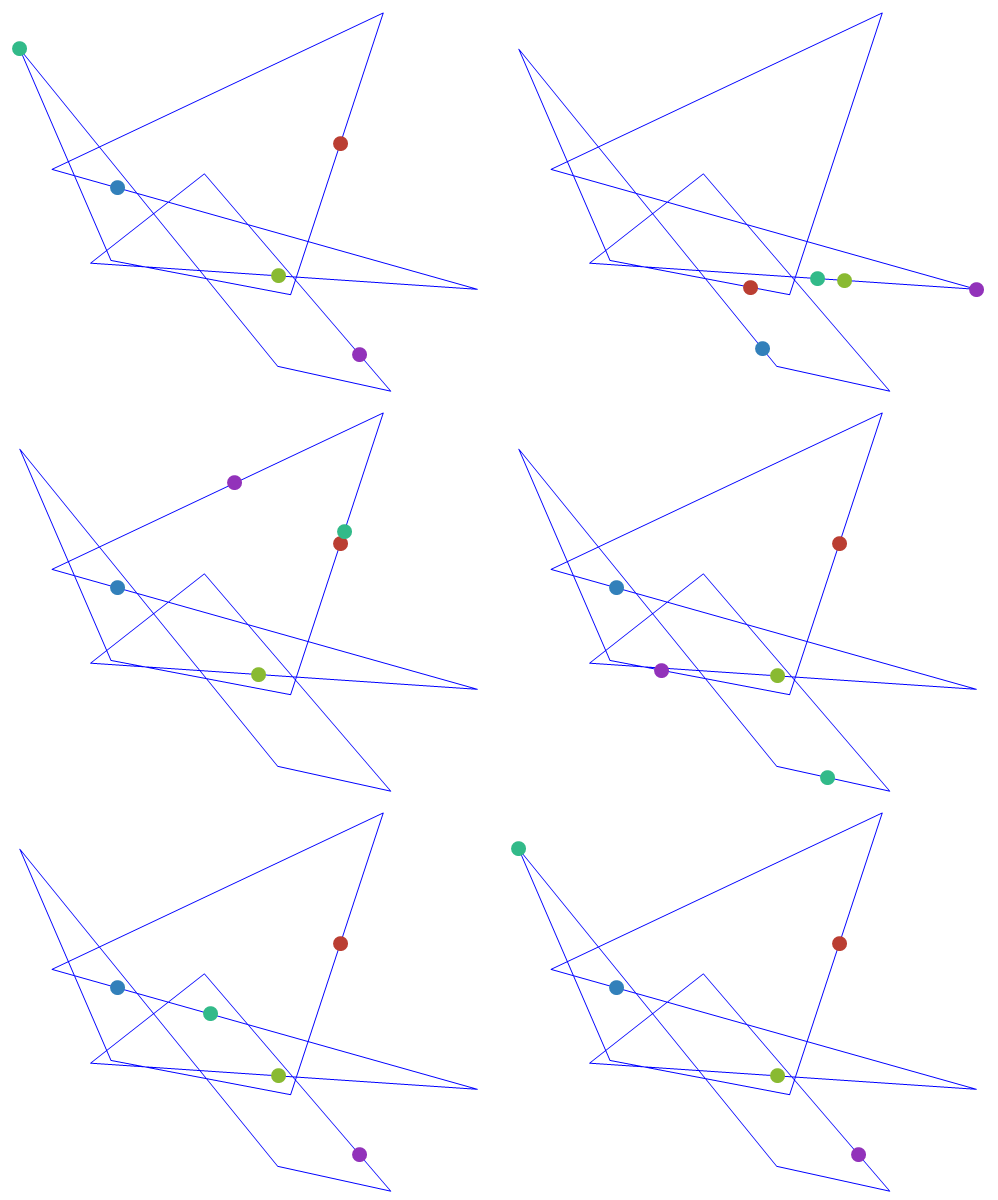
Multiple points moving at different speeds on the boundary of an arbitrary polygon and stopping after three tours:
SeedRandom[77]
coords = Append[#, First@#] &@RandomReal[1, {10, 2}];
pnts = Table[Graphics[{ColorData[63, "ColorList"][[i]], AbsolutePointSize[15],
Point[{0, 0}]}], {i, 5}];
Dynamic[Graphics[{Blue,
Arrowheads[Table[{.05, Mod[i/5 + Clock[{0, 1}, i, 3], 1], pnts[[i]]}, {i, 1,
5}]],
Arrow @ coords}, Axes -> False, PlotRange -> {{-.1, 1.1}, {-.1, 1.1}}]]
Arrowheads
+ Animate
Animate[Graphics[{Arrowheads[{{.05, t, pnt}}], Blue, Arrow @ coords},
Axes -> False], {t, 0, 1}]