Working with GraphicsComplex retains a degree of flexibility. For instance,
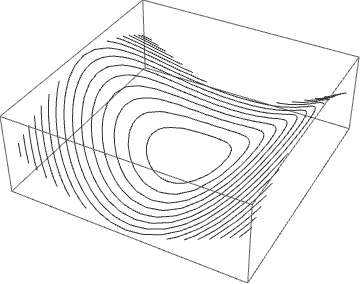
Graphics3D[GraphicsComplex[p[[1, 1]], Line[Rest@Cases[p, Line[z__] :> z, Infinity]]]]

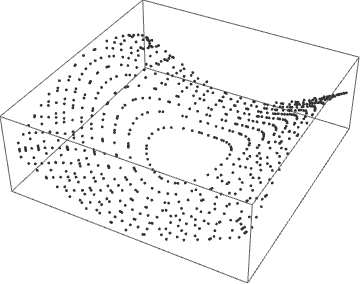
gives the Mesh in 3D. (Rest@ deletes the perimeter of the surface.) If, instead, a plot of the points in 3D is desired, use
Graphics3D[GraphicsComplex[p[[1, 1]],
  Point[Flatten[Rest@Cases[p, Line[z__] :> z, Infinity]]]]]

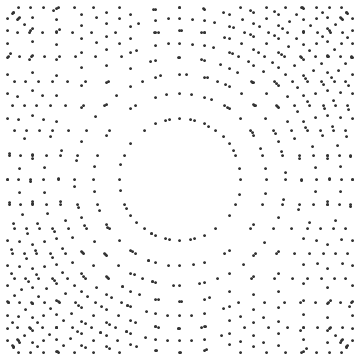
The same plot in 2D is obtained by dropping the last coordinate of each point.
p1 = Graphics[GraphicsComplex[Most /@ p[[1, 1]],
   Point[Flatten[Rest@Cases[p, Line[z__] :> z, Infinity]]]]]

Addendum
A List of the points themselves can be obtained directly from p.
Most /@ (p[[1, 1, #]] & /@ Flatten[Rest@Cases[p, Line[z__] :> z, Infinity]])
or from p1, the 2D plot,
p1[[1, 1, #]] & /@ Flatten[Cases[p1, Point[z__] :> z, Infinity]]
which is equivalent to
Cases[Normal[p1], Point[z__] :> z, Infinity]
suggested by Guesswhoitis and belisarius.
Note: It might be tempting to try simply, Most /@ (p[[1, 1, #]], but doing so also recovers hundreds of additional points used to construct the 3D surface.
