Explanation
In response to a comment below, this is how (more or less) I obtained the results above. To begin with, run
p//InputForm
to see what is inside, but be prepared for a lot of data. Basically, you will see the function GraphicsComplex, followed by several options at the very end. So, for instance,
Graphics3D[p[[1]]]
plots only the contents of the GraphicsComplex, which in this case is just the surface and the mesh lines.
The first argument of GraphicsComplex (see documentation) is a large array of 3D point locations, from which almost everything in the plot is constructed. The next argument consists of several other functions. What we care about here are Line functions, one for the boundary of the surface and one for each line in the mesh. The argument of Line is a list of indices, referring to the 3D points; i.e., Line[{3 ,127, 52}] draws a smooth curve from point 3 to point 127 to point 52.
The command
Line[Rest@Cases[p, Line[z__] :> z, Infinity]]
extracts a list of the lists of indices, throws away the first list (which is the outline of the surface), and puts them inside another Line function. Additionally p[[1, 1]] obtains the list of 3D points Finally, both of these items are repackaged in ``GraphicsComplex` and plotted.
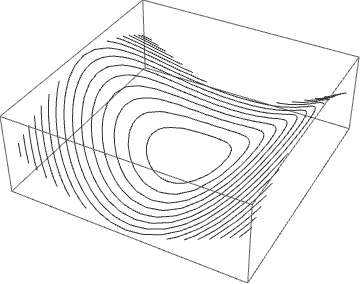
Graphics3D[GraphicsComplex[p[[1, 1]], Line[Rest@Cases[p, Line[z__] :> z, Infinity]]]]
giving the mesh lines in 3D shown in the first plot above.
If, instead, the Line indices are repackaged inside Point,
Point[Flatten[Rest@Cases[p, Line[z__] :> z, Infinity]]]
and combined with p[[1, 1]] inside GraphicsComplex, then
Graphics3D[GraphicsComplex[p[[1, 1]],
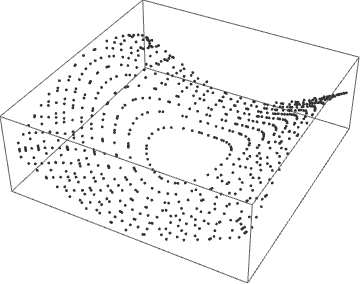
  Point[Flatten[Rest@Cases[p, Line[z__] :> z, Infinity]]]]]
gives a 3D plot of mesh points instead, as in the second plot above.
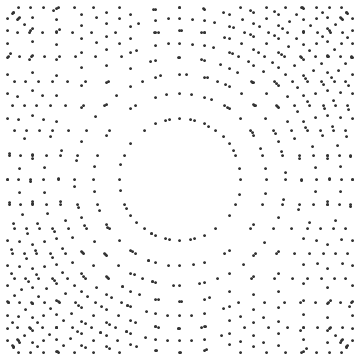
To obtain a 2D plot instead, use Most to discard the third dimension.
Graphics[GraphicsComplex[Most /@ p[[1, 1]],
   Point[Flatten[Rest@Cases[p, Line[z__] :> z, Infinity]]]]]
which gives the third plot above. I hope that this brief explanation is helpful.


