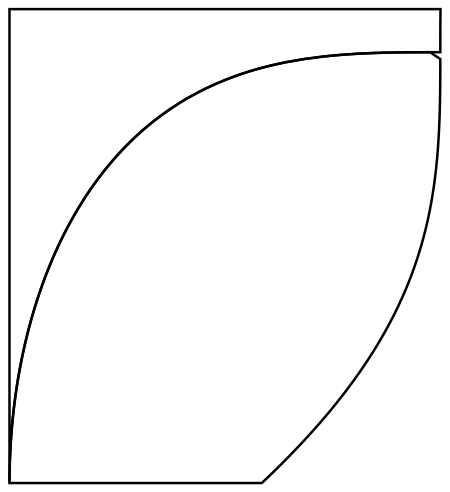
The "canonical" way is to find a pattern (here, {Black, Thick}) that matches what the boundary is made of and extract it from the graphics object.
So given
pt = RegionPlot[{{x^3 - y^2 > 2 y &&
     x^2 + y^3 > 2 x}, {x^3 - y^2 < 2 y && x^2 + y^3 > 2 x}}, {x, -1,
   1}, {y, -1, .1}, PlotStyle -> {Green, Yellow},
  BoundaryStyle -> {Black, Thick}];

bdy=Cases[Normal@First@pt, {Black, Thick, __}, Infinity];

Graphics[bdy]

