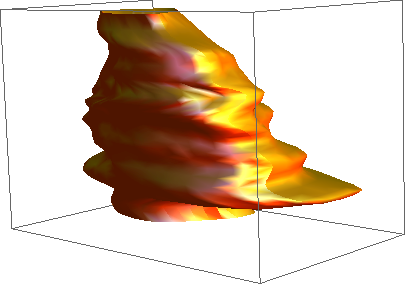
The natural way to go is BSplineFunction[]. The problem is that it needs a rectangular array of data as input and you collected a different number of points for each z plane.
So what we will do is to get an interpolating function for each z == const plane and generate an equal number of points at each plane. To be somewhat more clever, we could generate [evenly spaced points along each curve][1], but that small modification is left as an exercise.
Please note that the Spline Degree determines if the curve pass along your points exactly, or is just a smoothed approximation.
ClearAll["Global`*"];
ptv = Import["http://leaf.dragonflybsd.org/~beket/ptvgeom/ag1", "Table"];
Needs["DifferentialEquations`InterpolatingFunctionAnatomy`"];

gb = GatherBy[ptv, Last];
f[k_InterpolatingFunction, p_] :=
   k[p (Length @@ InterpolatingFunctionCoordinates[k] - 1) + 1]
t = Append[#, First@#] & /@
     Transpose@ Table[{f[Interpolation[#[[All, 1]]], p],
                       f[Interpolation[#[[All, 2]]], p], #[[1, 3]]}& /@ gb,
                      {p, 0, 1, 0.005}];
s = BSplineFunction[t];
ParametricPlot3D[s[u, v], {u, 0, 1}, {v, 0, 1},
                 PlotStyle -> {Orange, Specularity[White, 10]},
                 Axes -> None, Mesh -> None]

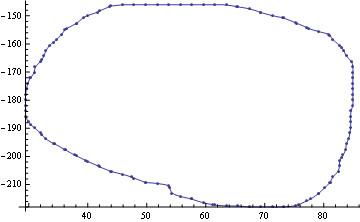
f = BSplineFunction[Most /@ t[[1]]]
Show[{ListPlot[Most /@ gb[[1]]], ParametricPlot[f[t], {t, 0, 1}]}]

