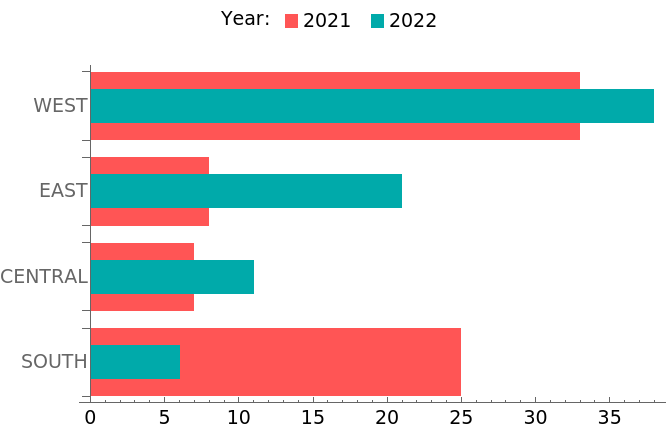
We can also use a custom DisplayFunction that post-processes BarChart output to rescale rectangle groups:
centerRectangleGroups = Replace[#,
    p : {{_Directive, _[_[_Rectangle, ___], ___]} ..} :>
     MapIndexed[Scale[#, {1, 1/#2[[1]]}] &, p], All] &;
Examples:
SeedRandom[1];

data = RandomInteger[{5, 40}, {4, 2}];

chartstyle = {Lighter @ Red, Darker @ Cyan};

legendlabels = Range[2021, 2022];

options = {
   DisplayFunction -> centerRectangleGroups,
   BarSpacing -> {-1, .25},
   BarOrigin -> Left,
   ChartStyle -> chartstyle,
   ChartBaseStyle -> EdgeForm[],
   ChartLabels -> {{"SOUTH", "CENTRAL", "EAST", "WEST"}, None},
   ChartLegends -> Placed[SwatchLegend[legendlabels,
      LegendLabel -> Placed["Year:", Before], LegendLayout -> "Row"],
     Above],
   LabelStyle -> 14, ImageSize -> 500
   };


BarChart[data, options]
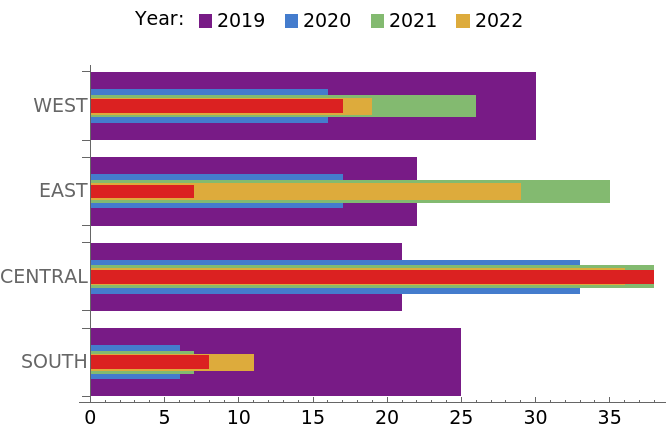
Replace data = RandomInteger[{5, 40}, {4, 2}]; with data = RandomInteger[{5, 40}, {4, 5}];, chartstyle = {Lighter@Red, Darker@Cyan}; with chartstyle = "Rainbow" and legendlabels = Range[2021, 2022]; with legendlabels = Range[2019, 2022]; above to get


