I'm trying to plot the following implicit equation in 3D:
Sqrt[x^2+y^2-z^2]+Sqrt[-x^2+y^2+z^2]+Sqrt[x^2-y^2+z^2]=Sqrt[2]
The code I used is:
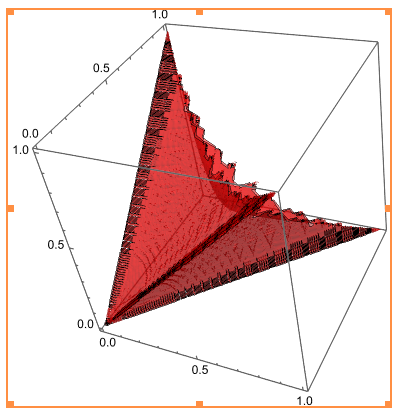
ContourPlot3D[Sqrt[x^2 + y^2 - z^2] + Sqrt[x^2 - y^2 + z^2] + Sqrt[-x^2 + y^2 + z^2] == Sqrt[2], {x, 0, 1}, {y, 0, 1}, {z, 0, 1}, Mesh -> None, ContourStyle -> {Red, Opacity[0.5]}, MaxRecursion -> 3]
However, the resulting contour plot is weird:
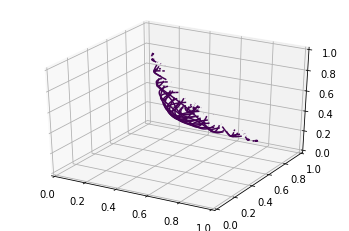
While the correct result should be something like the following (made with python)
Could someone help me to identify the issue? Thank you!
Edit: I know the python result is correct because I tried to calculate a few explicit numerical solutions myself.
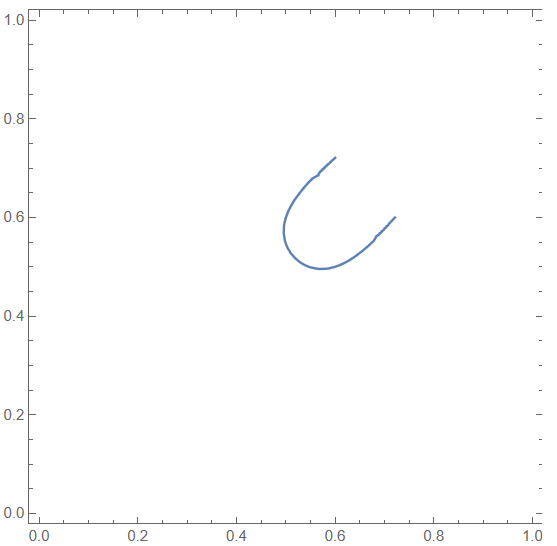
I also tried to plot an x-y intersection when z=0.4 to see how it looks in Mathematica:
k = 0.4;
ContourPlot[
 Sqrt[x^2 + y^2 - k^2] + Sqrt[x^2 - y^2 + k^2] +
   Sqrt[-x^2 + y^2 + k^2] == Sqrt[2], {x, 0, 1}, {y, 0, 1},
 Mesh -> None, Axes -> False]
The python code I used was (which is from this answer)
from mpl_toolkits.mplot3d import axes3d
import matplotlib.pyplot as plt
import numpy as np

def plot_implicit(fn, bbox=(0,1)):
    ''' create a plot of an implicit function
    fn  ...implicit function (plot where fn==0)
    bbox ..the x,y,and z limits of plotted interval'''
    xmin, xmax, ymin, ymax, zmin, zmax = bbox*3
    fig = plt.figure()
    ax = fig.add_subplot(111, projection='3d')
    A = np.linspace(xmin, xmax, 100) # resolution of the contour
    B = np.linspace(xmin, xmax, 15) # number of slices
    A1,A2 = np.meshgrid(A,A) # grid on which the contour is plotted

    for z in B: # plot contours in the XY plane
        X,Y = A1,A2
        Z = fn(X,Y,z)
        cset = ax.contour(X, Y, Z+z, [z], zdir='z')
        # [z] defines the only level to plot for this contour for this value of z

    for y in B: # plot contours in the XZ plane
        X,Z = A1,A2
        Y = fn(X,y,Z)
        cset = ax.contour(X, Y+y, Z, [y], zdir='y')

    for x in B: # plot contours in the YZ plane
        Y,Z = A1,A2
        X = fn(x,Y,Z)
        cset = ax.contour(X+x, Y, Z, [x], zdir='x')

    # must set plot limits because the contour will likely extend
    # way beyond the displayed level.  Otherwise matplotlib extends the plot limits
    # to encompass all values in the contour.
    ax.set_zlim3d(zmin,zmax)
    ax.set_xlim3d(xmin,xmax)
    ax.set_ylim3d(ymin,ymax)

    plt.show()

def surface(x,y,z):
    return np.sqrt(-x*x + y*y + z*z) + np.sqrt(x*x - y*y + z*z) + np.sqrt(x*x + y*y - z*z)- np.sqrt(2)

plot_implicit(surface)


