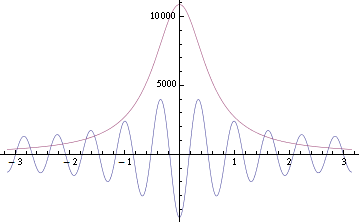
I have the following code:
ser[x_] = FourierSeries[(\[Pi]^2 + a)/(3 x^2 + a), x, 10] // N // Chop
It gives me some series, which I then try to plot. And surprisingly, the result isn't even similar to the function I passed to FourierSeries[]: for comparison, I've used this code:
Plot[{ser[x], 1000 (\[Pi]^2 + a)/(3 x^2 + a)}, {x, -\[Pi], \[Pi]}]

Fourier transform for function given in documentation works correctly, while for this one doesn't. I've tried using directly the formula given in documentation as default formula (used NIntegrate[]), and that gives me expected results.
What have I done wrong? Is this a bug?
