f[x_] := x;
T = 2;
(*
a0 = 2coe[f, Cos, T, 0]
a[k_] := coe[f, Cos, T, k]
b[k_] := coe[f, Sin, T, k]
*)
coe[func_, type: Cos | Sin, per_, order_Integer] := coe[func, type, per, order] = Module[
    {min = -per/2, max = per/2, factor = If[order == 0, 1/2, 1], x},
    Return[
        (2factor)/per Integrate[func[x] type[(2\[Pi] order)/per x], {x, min, max}]
]];
(*
g[x_, n_] := partsum[f, T, n][x]
*)
partsum[func_, per_, order_Integer] := partsum[func, per, order] = Module[
    {},
    x\[Function]
        Sum[
            coe[func, Sin, per, i] Sin[(2\[Pi] i)/per x] +
            coe[func, Cos, per, i] Cos[(2\[Pi] i)/per x],
        {i, 0, order}]
];
(* Interpolation *)
partsumtrans[func_, per_, order1_Integer, order2_Integer, tall_]
    /;order2>order1 :=
    partsumtrans[func, per, order1, order2, tall] =
    Module[{nth = order2 - order1},
        t\[Function](
            x\[Function](
                (1-SawtoothWave[nth t/tall])
                partsum[func, per,
                     order1+Floor[t/tall nth]][x]+
                SawtoothWave[nth t/tall]
                partsum[func, per,
                     order1+Floor[t/tall nth]+1][x]))
]
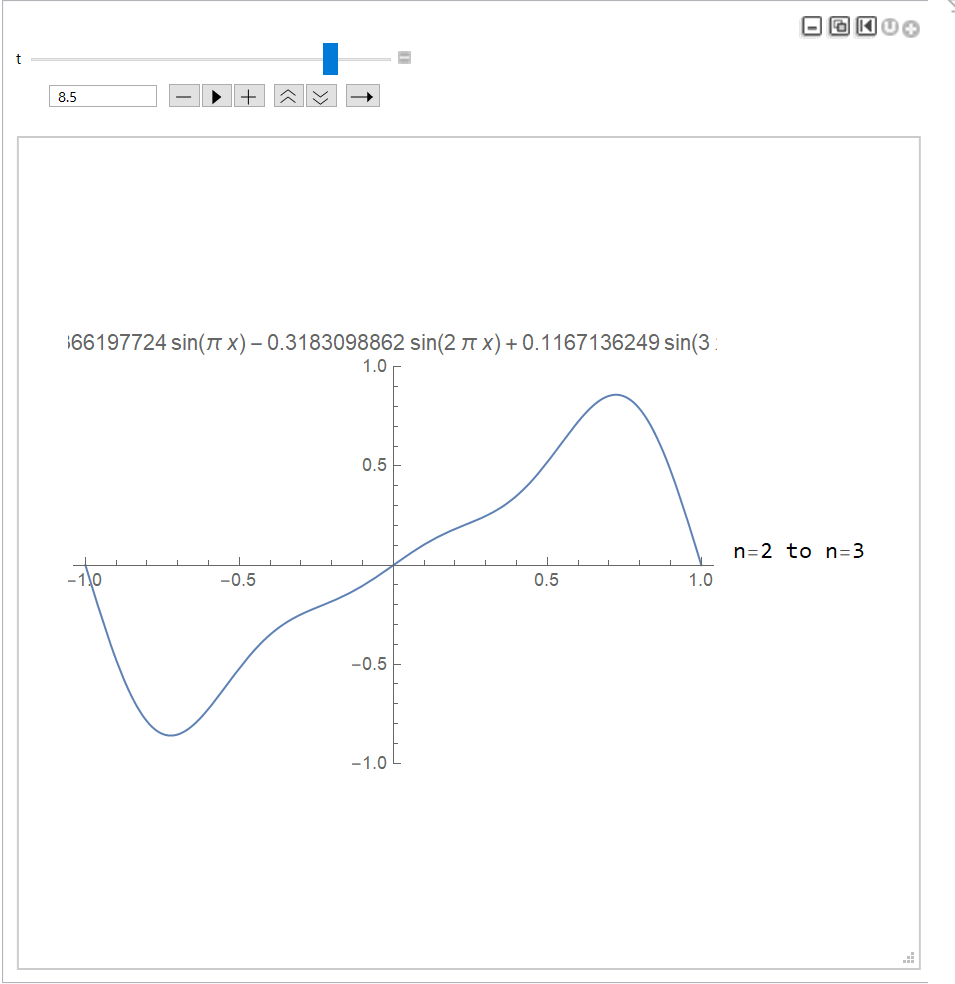
And you can use them to construct a demonstration:
Manipulate[Plot[partsumtrans[f, T,  0, 3, 10][t][x], {x, -1, 1},
    PlotRange->1,
    PlotLegends->If[IntegerQ@(3/10t), "n="<>ToString[0+3/10t],
        "n="<>ToString[Floor[0+3/10t]]<>
        " to "<>"n="<>ToString[Ceiling[0+3/10t]]],
    PlotLabel->TraditionalForm[
        FullSimplify[partsumtrans[f, T, 0, 3, 10][t][x]]]
    ], {t, 0, 10},
    AppearanceElements->All,
    ContentSize->{500, 460},
    Alignment->{0, 0}]
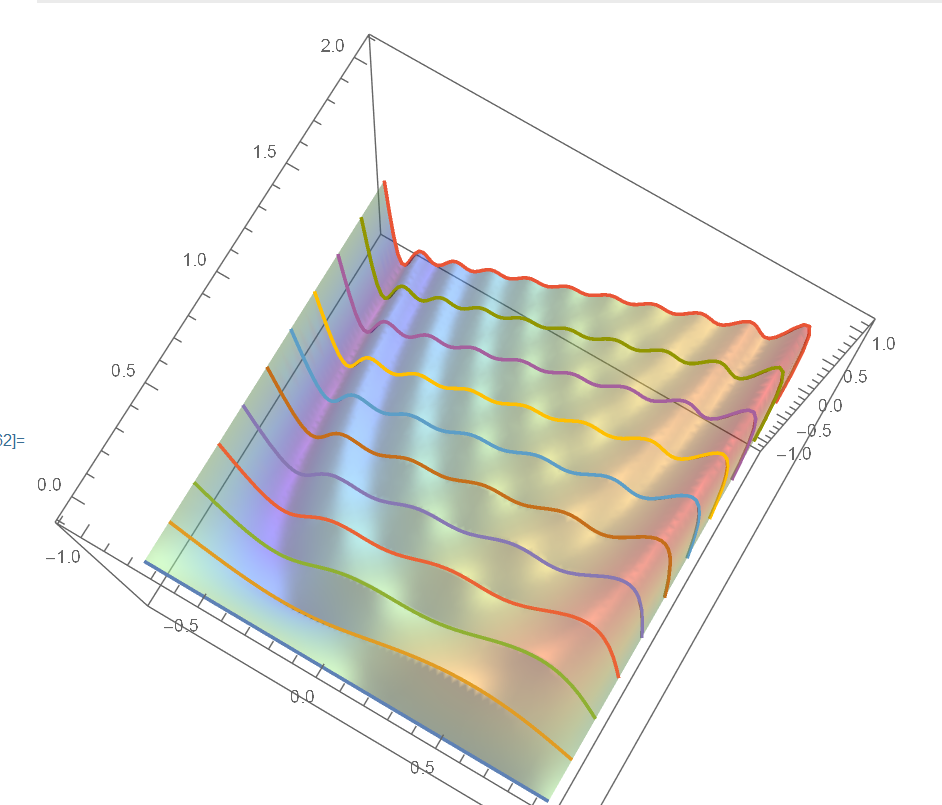
@Bob Hanlon Style:
Show[ParametricPlot3D[
    Evaluate[{x, 2#/10, partsum[f, T, #][x]}&/@Range[0, 10]],
    {x, -1, 1},
    PlotStyle->Thick
],
ParametricPlot3D[
    {x, y, partsumtrans[f, T, 0, 10, 2][y][x]},
    {x, -1, 1}, {y, 0, 2},
    Exclusions->None,
    Mesh->None, PlotStyle->Directive[Opacity[.5]],
    ColorFunction->"Rainbow",
    PlotPoints->30
]]
Also, you can change the interpolation-function partsumtrans to get different performance.


