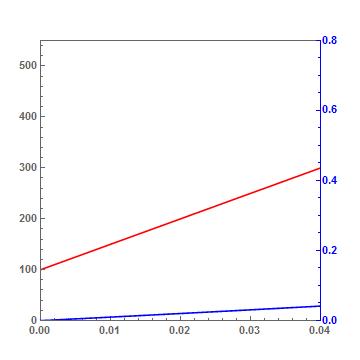
I have two plots, as seen below, Plot1 and Plot2 with a common x-axis. Each plot has a different range of y-axis and I overlay them. I want to remove the minor ticks from the frames of each plot and then overlay. How do I do this?
ClearAll["Global`*"]
xaxis1 = 0;
xaxis2 = 0.04;
yaxis1 = 0;
yaxis2 = 550;
PlotA = Plot[{5000*Sa + 100 }, {Sa, xaxis1, xaxis2 },
  PlotStyle -> Red,
  PlotRange -> {{xaxis1, xaxis2}, {yaxis1, yaxis2}},
  LabelStyle -> {FontSize -> 12, Bold}, Frame -> True]

yaxis1 = 0;
yaxis2 = 0.8;
PlotB = Plot[{Sa^2 + Sa }, {Sa, xaxis1, xaxis2 }, PlotStyle -> Blue,
  PlotRange -> {{xaxis1, xaxis2}, {yaxis1, yaxis2}},
  LabelStyle -> {FontSize -> 12, Bold}, Frame -> True]

Plot1 = Show[PlotA, LabelStyle -> {FontSize -> 10.5, Bold},
   Frame -> {{True, False}, {True, True}}, ImagePadding -> 40,
   FrameTicks -> {{All, All}, {All, None}}, AspectRatio -> 1];

Plot2 = Show[PlotB, LabelStyle -> {FontSize -> 10.5, Bold},
   FrameTicks -> {{None, All}, {None, All}},
   Frame -> {{False, True}, {False, False}}, ImagePadding -> 40,
   FrameStyle -> {{Automatic, Blue}, {Automatic, Automatic}},
   AspectRatio -> 1];
Overlay[{Plot1, Plot2}]

