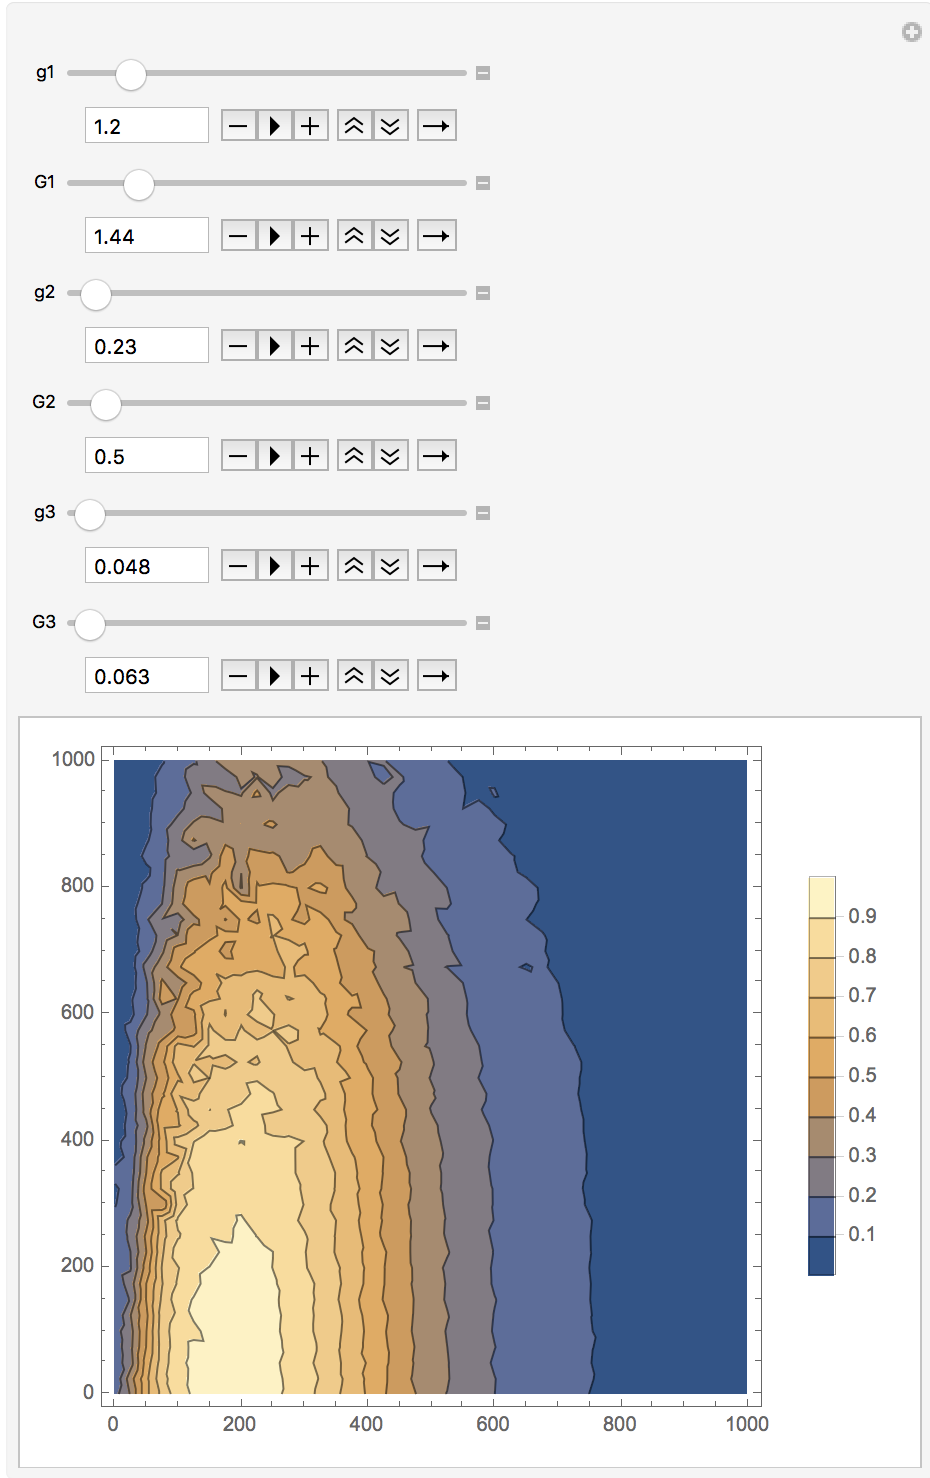
I have managed to manipulate functions from a list of data points. The data table is large and thus is in this link.
data = Import["util.dat"]
Clear[utl]
utl[x1_, g_, G_] :=
 1/(1 + Exp[(4.39445/(g - G)) x1 + (2.19722 (g + G)/(G - g))])
Manipulate[ListContourPlot[
  {#[[1]], #[[2]],
     utl[#[[3]], g1, G1]* utl[#[[4]], g2, G2]*utl[#[[5]], g3, G3]} & /@
    data, PlotLegends -> Automatic
  ], {g1, 0.001, 10, 0.001}, {G1, 0.01, 10, 0.001}, {g2, 0.001, 10,
  0.001}, {G2, 0.01, 10, 0.001}, {g3, 0.001, 10, 0.001}, {G3, 0.01,
  10, 0.001}]
An example of representation giving parameters g1,G1,g2,G2,g3,G3 can be the following:
I would like is to plot the point of the maximum value of the utl[] function and to get the numbers of the first and second columns from data (the coordinates in the ListContourPlot[]) of that point.

