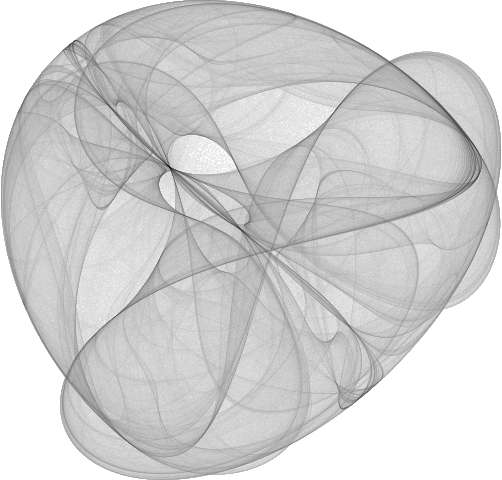
Parameters:
a = -1.24458; b = -1.25191; c = -1.815908; d = -1.90866;
Compiled function used for iteration:
cf = Compile[{{pt, _Real, 1}},
   {Sin[a pt[[2]]] + c Cos[pt[[1]]],
    Sin[b pt[[1]]] + d Cos[pt[[2]]]},
   CompilationOptions -> {"InlineExternalDefinitions" -> True}
   ];
Iterate, rescale the result to the box {{0,1},{0,1}}, histogram it, convert to an image, and finally apply a gamma adjustment (^0.5) for better visibility.
im = ImageAdjust@Image@BinCounts[
     Rescale@NestList[cf, {0., 0.}, 1000000],
     1/500., 1/500.
     ];
ColorNegate[im^0.5]
With 10 million points and $\gamma = 1/3$, I get

