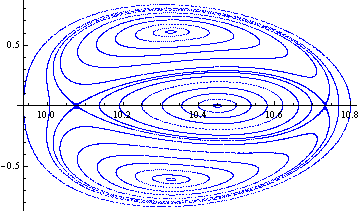
In this case it is not easy to work with a MWE, so I shall use the actual data. I have a data file which contains initial conditions $(x,y,p_x,p_y)$.
Let's see how the data look on the $(x,y)$ plane
data = Import["4D_3200.dat", "Table"];
d0 = data[[All, {1, 2}]];
L0 = ListPlot[d0, PlotStyle -> {Blue, PointSize[0.001]}]
It is seen that the data are not random. The data file contains about 21000 initial conditions.
Question #1: How can I generate, let's say 100000, $(x,y)$ initial conditions inside the oval region of the above plot?
Question #2: Assuming that we have generated 100000 $(x,y)$ initial conditions, inside the oval region, how can we exploit the original data in order to interpolate the momenta $p_x$ and $p_y$ of the additional initial conditions?
In other words, we have an initial distribution of $N$ initial conditions and we want to generate more.
Any suggestions?
Many thanks in advance!

