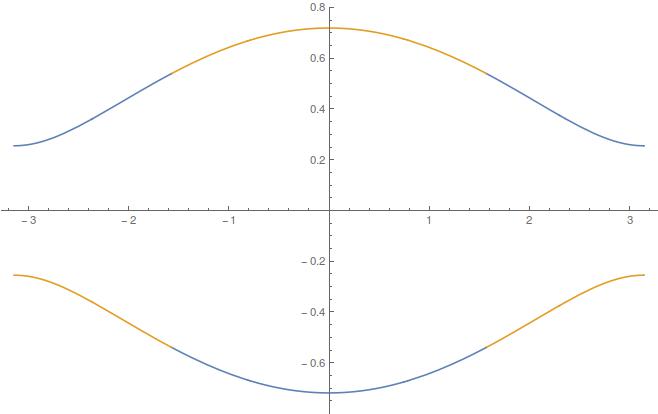
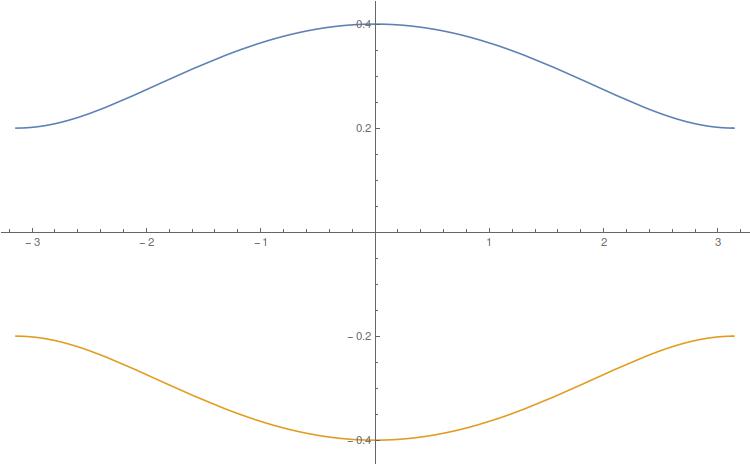
I have a matrix whose eigenvalues have to be plotted. I am using two techniques but they are not the same. Please guide me on this.
Here is first command or code used for plotting the eigenvalues(two in my case)
a := 1;
SM[j1_, j2_, k_] := {{0, -(j1 + j2*Exp[I*k*a])}, {-(j1 + (j2*Exp[-I*k*a])),
    0}};
eigenen[j1_, j2_, k_] := Module[{EV1}, EV1 = Eigenvalues[SM[j1, j2, k]];
  Plot[EV1, {k, -\[Pi]/a, \[Pi]/a}, PlotLegends -> "Expressions"]]
Manipulate[eigenen[j1, j2, k], {j1, 0.1, 1}, {j2, 0.1, 1}]
Result is (j1>j2, you can take j1=0.3, j2=0.1)

Second used code
a:=1;
PowerExpand[FullSimplify[Eigenvalues[ {{0, -(j1 + j2*Exp[I*ka])},{-(j1 + j2*Exp[-I*ka]), 0}} ]]]

Out:= {-Sqrt[j1^2 + j2^2 + 2 j1 j2 Cos[ka]], Sqrt[j1^2 + j2^2 + 2 j1 j2 Cos[ka]]}
Manipulate[Plot[{Sqrt[(j1^2 + j2^2 + 2 j1 j2 Cos[k*a])], -Sqrt[(j1^2 + j2^2 + 2 j1 j2 Cos[k*a])]}, {k, -\[Pi]/a, \[Pi]/a},
  PlotLegends -> "Expressions"], {j1, 0.1, 1}, {j2, 0.1, 1}]
For this result is (j1>j2, you can take j1=0.3, j2=0.1)

I have no idea about the difference but I will be using first code more often as I later have to deal with large matrices(40$\times$ 40), where I can't simply write the eigenvalues. Is there any effective or similar code where this problem can be resolved?
My queries(to summarise):
(i) Reason(s) for the difference in the plots.
(ii) Anyway the second code can be resolved to give similar results as Ist one(those are expected ones), not the IInd ones.
