Update
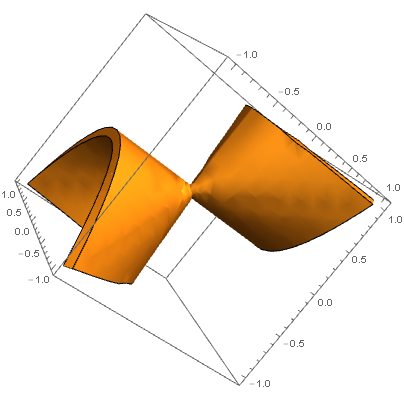
Creating a table of data for the evaluated function allows for control of "grid" size and domain which produces the smoothest part once plotted.
data = Table[x*z - y^2, {z, -1, 1, 0.01}, {y, -1, 1, 0.01}, {x, -1, 1, 0.01}];
ListContourPlot3D[data, Contours -> {0}, Mesh -> None,
   Extrusion -> 0.1, DataRange -> {{-1, 1}, {-1, 1}, {-1, 1}}]
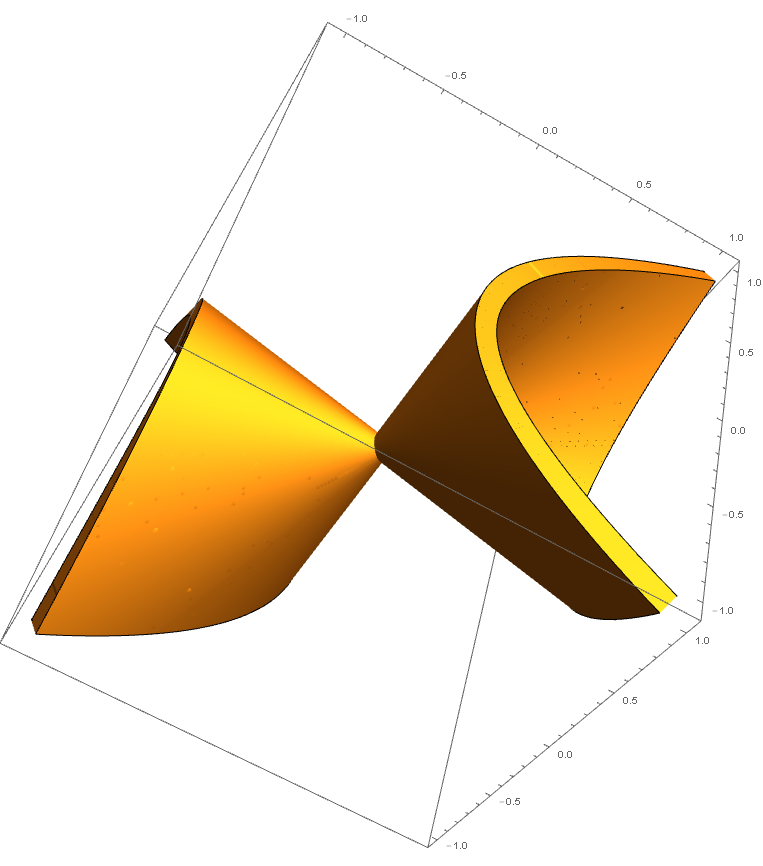
Use the undocumented Extrusion option and increase PlotPoints for higher resolution:
ContourPlot3D[x*z - y^2 == 0, {x, -1, 1}, {y, -1, 1}, {z, -1, 1},
 Mesh -> None, Extrusion -> 0.1,PerformanceGoal -> "Quality", PlotPoints -> 500]


