replaced http://mathematica.stackexchange.com/ with https://mathematica.stackexchange.com/
Source Link

Update

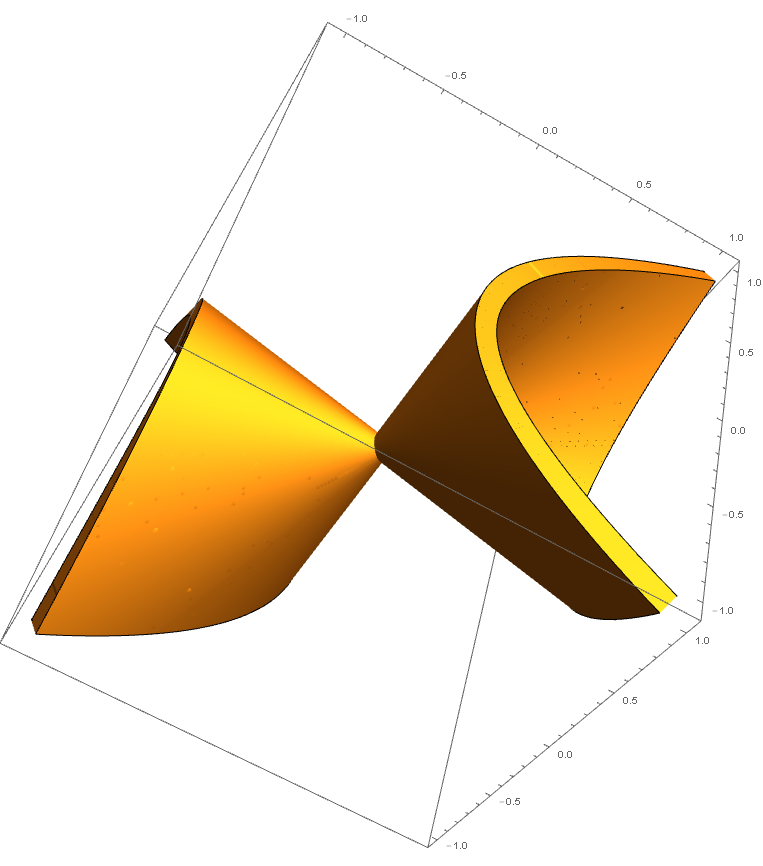
Creating a table of data for the evaluated function allows for control of "grid" size and domain which produces the smoothest part once plotted.

data = Table[x*z - y^2, {z, -1, 1, 0.01}, {y, -1, 1, 0.01}, {x, -1, 1, 0.01}];
ListContourPlot3D[data, Contours -> {0}, Mesh -> None, 
   Extrusion -> 0.1, DataRange -> {{-1, 1}, {-1, 1}, {-1, 1}}]

enter image description here


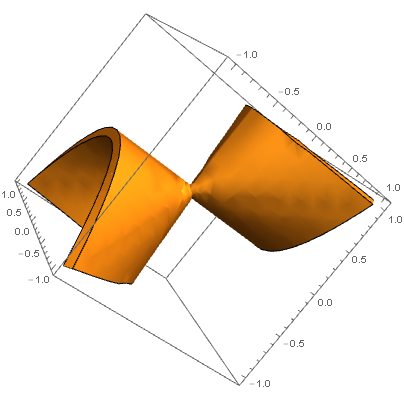
Use the undocumented Extrusion option and increase PlotPoints for higher resolution:

ContourPlot3D[x*z - y^2 == 0, {x, -1, 1}, {y, -1, 1}, {z, -1, 1}, 
 Mesh -> None, Extrusion -> 0.1,PerformanceGoal -> "Quality", PlotPoints -> 500]

enter image description here

References:

How to add Thickness in ListContourPlot3DHow to add Thickness in ListContourPlot3D

Increase 3D Graph thickness for 3D printing in Mathematica?Increase 3D Graph thickness for 3D printing in Mathematica?

Update

Creating a table of data for the evaluated function allows for control of "grid" size and domain which produces the smoothest part once plotted.

data = Table[x*z - y^2, {z, -1, 1, 0.01}, {y, -1, 1, 0.01}, {x, -1, 1, 0.01}];
ListContourPlot3D[data, Contours -> {0}, Mesh -> None, 
   Extrusion -> 0.1, DataRange -> {{-1, 1}, {-1, 1}, {-1, 1}}]

enter image description here


Use the undocumented Extrusion option and increase PlotPoints for higher resolution:

ContourPlot3D[x*z - y^2 == 0, {x, -1, 1}, {y, -1, 1}, {z, -1, 1}, 
 Mesh -> None, Extrusion -> 0.1,PerformanceGoal -> "Quality", PlotPoints -> 500]

enter image description here

References:

How to add Thickness in ListContourPlot3D

Increase 3D Graph thickness for 3D printing in Mathematica?

added 242 characters in body
Source Link
Young
  • 7.5k
  • 1
  • 22
  • 46

Update

Creating a table of data for the evaluated function allows for control of "grid" size and domain which produces the smoothest part once plotted.

data = Table[x*z - y^2, {z, -1, 1, 0.01}, {y, -1, 1, 0.01}, {x, -1, 1, 0.01}];
ListContourPlot3D[data, Contours -> {0}, Mesh -> None, 
   Extrusion -> 0.1, DataRange -> {{-1, 1}, {-1, 1}, {-1, 1}}]

enter image description here


Use the undocumented Extrusion option and increase PlotPoints for higher resolution:

ContourPlot3D[x*z - y^2 == 0, {x, -1, 1}, {y, -1, 1}, {z, -1, 1}, 
 Mesh -> None, Extrusion -> 0.1,PerformanceGoal -> "Quality", PlotPoints -> 500]

enter image description here

References:

How to add Thickness in ListContourPlot3D

Increase 3D Graph thickness for 3D printing in Mathematica?

Update

Creating a table of data for the evaluated function allows for control of "grid" size and domain which produces the smoothest part once plotted.

data = Table[x*z - y^2, {z, -1, 1, 0.01}, {y, -1, 1, 0.01}, {x, -1, 1, 0.01}];
ListContourPlot3D[data, Contours -> {0}, Mesh -> None, 
   Extrusion -> 0.1, DataRange -> {{-1, 1}, {-1, 1}, {-1, 1}}]

enter image description here


Use the undocumented Extrusion option and increase PlotPoints for higher resolution:

ContourPlot3D[x*z - y^2 == 0, {x, -1, 1}, {y, -1, 1}, {z, -1, 1}, 
 Mesh -> None, Extrusion -> 0.1,PerformanceGoal -> "Quality", PlotPoints -> 500]

enter image description here

References:

How to add Thickness in ListContourPlot3D

Increase 3D Graph thickness for 3D printing in Mathematica?

deleted 9 characters in body
Source Link
Young
  • 7.5k
  • 1
  • 22
  • 46

Update

Creating a table of data for the evaluated function allows for control of "grid" size and domain which produces the smoothest part once plotted.

data = Table[
   x*zTable[x*z - y^2, {z, -1, 1, 0.01}, {y, -1, 1, 0.01}, {x, -1, 1, 0.01}];
ListContourPlot3D[data, Contours -> {0}, Mesh -> None, 
   Extrusion -> 0.1, DataRange -> {{-1, 1}, {-1, 1}, {-1, 1}}]

enter image description here


Use the undocumented Extrusion option and increase PlotPoints for higher resolution:

ContourPlot3D[x*z - y^2 == 0, {x, -1, 1}, {y, -1, 1}, {z, -1, 1}, 
 Mesh -> None, Extrusion -> 0.1,PerformanceGoal -> "Quality", PlotPoints -> 500]

enter image description here

Update

Creating a table of data for the evaluated function allows for control of "grid" size and domain which produces the smoothest part once plotted.

data = Table[
   x*z - y^2, {z, -1, 1, 0.01}, {y, -1, 1, 0.01}, {x, -1, 1, 0.01}];
ListContourPlot3D[data, Contours -> {0}, Mesh -> None, 
   Extrusion -> 0.1, DataRange -> {{-1, 1}, {-1, 1}, {-1, 1}}]

enter image description here


Use the undocumented Extrusion option and increase PlotPoints for higher resolution:

ContourPlot3D[x*z - y^2 == 0, {x, -1, 1}, {y, -1, 1}, {z, -1, 1}, 
 Mesh -> None, Extrusion -> 0.1,PerformanceGoal -> "Quality", PlotPoints -> 500]

enter image description here

Update

Creating a table of data for the evaluated function allows for control of "grid" size and domain which produces the smoothest part once plotted.

data = Table[x*z - y^2, {z, -1, 1, 0.01}, {y, -1, 1, 0.01}, {x, -1, 1, 0.01}];
ListContourPlot3D[data, Contours -> {0}, Mesh -> None, 
   Extrusion -> 0.1, DataRange -> {{-1, 1}, {-1, 1}, {-1, 1}}]

enter image description here


Use the undocumented Extrusion option and increase PlotPoints for higher resolution:

ContourPlot3D[x*z - y^2 == 0, {x, -1, 1}, {y, -1, 1}, {z, -1, 1}, 
 Mesh -> None, Extrusion -> 0.1,PerformanceGoal -> "Quality", PlotPoints -> 500]

enter image description here

added 499 characters in body
Source Link
Young
  • 7.5k
  • 1
  • 22
  • 46
Loading
added 499 characters in body
Source Link
Young
  • 7.5k
  • 1
  • 22
  • 46
Loading
deleted 242 characters in body
Source Link
Young
  • 7.5k
  • 1
  • 22
  • 46
Loading
added 96 characters in body
Source Link
Young
  • 7.5k
  • 1
  • 22
  • 46
Loading
added 35 characters in body
Source Link
Young
  • 7.5k
  • 1
  • 22
  • 46
Loading
added 207 characters in body
Source Link
Young
  • 7.5k
  • 1
  • 22
  • 46
Loading
Source Link
Young
  • 7.5k
  • 1
  • 22
  • 46
Loading