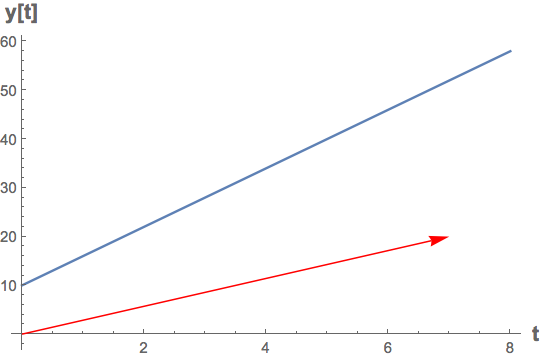
For example I want to plot the vector <7, 20> on the same plot as the line {t, 6t+10}
1 Answer
$\begingroup$
$\endgroup$
2
Plot[
 Tooltip[6 t + 10], {t, 0, 8},
 Epilog -> {Red,
   Tooltip[
    Arrow[{{0, 0}, {7, 20}}],
    "Vector <7, 20>"]},
 AxesOrigin -> {0, 0},
 AxesLabel -> (Style[#, 14, Bold] & /@
    {"t", "y[t]"})]
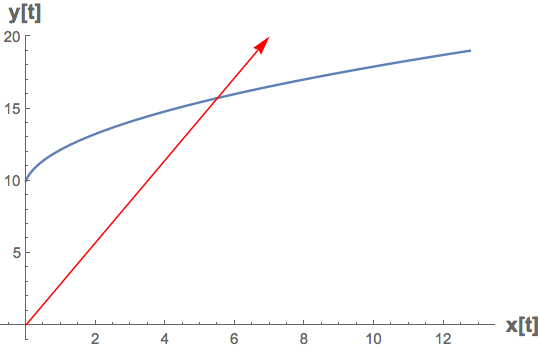
EDIT: For a parametric curve rather than a line use ParametricPlot
ParametricPlot[
 Tooltip[{t + 5 t^2, 6 t + 10}], {t, 0, 3/2},
 Epilog -> {Red, Tooltip[Arrow[{{0, 0}, {7, 20}}], "Vector <7, 20>"]},
  AxesOrigin -> {0, 0},
 AxesLabel -> (Style[#, 14, Bold] & /@
    {"x[t]", "y[t]"}),
 AspectRatio -> 1/GoldenRatio]
-
$\begingroup$ What if I want to plot the vector <7, 20> on the same plot as the line {t + 5t^2, 6t+10} $\endgroup$– NikaCommented Sep 26, 2015 at 16:04
-
$\begingroup$ To plot a curve rather than a line, use
ParametricPlot$\endgroup$ Commented Sep 26, 2015 at 16:21


