6
$\begingroup$

I was trying to perform computational fluid dynamics (CFD) post-processing in Mathematica after solving primitive variables from Navier-Stokes equation, mainly $(u,v)$, $(Px,Py)$. Since I am not an expert with the finite difference and NDSolve functionality of Mathematica, I used FORTRAN to perform numerical simulation.

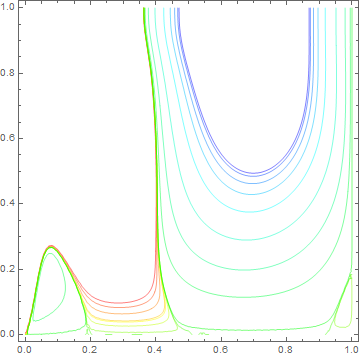
The objective is to generate streamlines and vorticity from $u$ and $v$ values in Mathematica.

I looked online and found this link : http://bugman123.com/FluidMotion/index.html where vorticity and streamlines calculations were demonstrated.

I tried cloning the same code using

u = Import["F:\\Lid_Driven_Cavit\\Run_Max_Interations\\u_final.dat", "CSV"];

v = Import["F:\\Lid_Driven_Cavit\\Run_Max_Interations\\v_final.dat","CSV"];

(* u and v represents velocity components in x and y directions     
   respectively *)

n = Dimensions[u, 1];

dx = 1/(n - 1);

dy = dx;

\[Psi]= \[Integral]u dx= \[Integral]v dy
\[Omega]= \[PartialD]v/dx-\[PartialD]u/dy


psi = Table[0, {n - 1}, {n - 1}]; Do[
psi[[i, j]] =psi[[i, j - 1]] + dx (u[[i + 1, j - 1]] + u[[i + 1, j]])/2,{j, 2, n - 1}, {i, 1, n - 1}];

psi = ListInterpolation[psi, {{0, 1}, {0, 1}}];

ContourPlot[psi[x, y], {x, 0, 1}, {y, 0, 1}, PlotPoints -> 50, 
PlotRange -> All, ContourShading -> False, 
Contours -> {-0.08, -0.077,-0.07, -0.06, -0.045, -0.025, -0.01,-0.0025, 0,-8*^-6, 2*^-6, 3*^-5, 8*^-5, 1*^-4, 3*^-4, 6*^-4, 9*^-4},
ContourStyle -> Table[{Hue[2 (1 - x)/3]}, {x, 0, 1, 1/16}]]

But this is not working. I am not sure of the error but I am trying to generate the same code as mentioned in the website.

Also for the omega

omega = ListInterpolation[Table[(v[[i, j]] - v[[i - 1, j]])/dx - (u[[i, j]]-  u[[i, j - 1]])/ dx, 
  {i, 2, n - 1}, {j, 2, n - 1}], {{0, 1}, {0, 1}}];
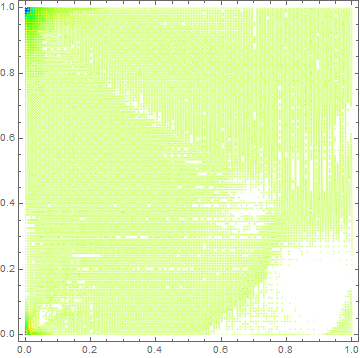
  ContourPlot[omega[x, y], {x, 0, 1}, {y, 0, 1}, PlotPoints -> 50, 
  PlotRange -> All, ContourShading -> False, Contours -> Range[-14, 7],
  ContourStyle -> Table[{Hue[2 (1 - x)/3]}, {x, 0, 1, 1/21}]]

But this is not working as well.

Here is the initial data:

u.dat & v.dat

$\endgroup$

2 Answers 2

4
$\begingroup$

To be honest, the code you found isn't a good example of coding in Mathematica. I think the following 3 lines are enough for you:

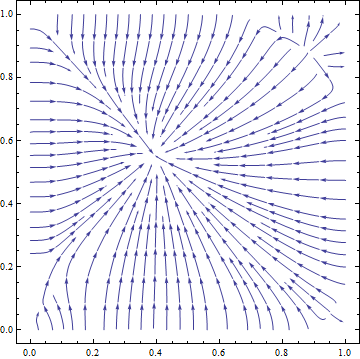
ListStreamPlot[Transpose[{u, v}, {3, 1, 2}], DataRange -> {{0, 1}, {0, 1}}]
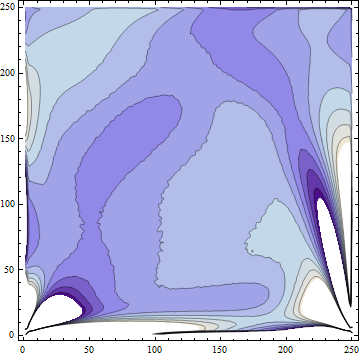
curl = Most /@ Differences@v - Most@Differences[u, {0, 1}];
ListContourPlot@LowpassFilter[curl, 1]

enter image description here enter image description here

You may also want to try ListDensityPlot:

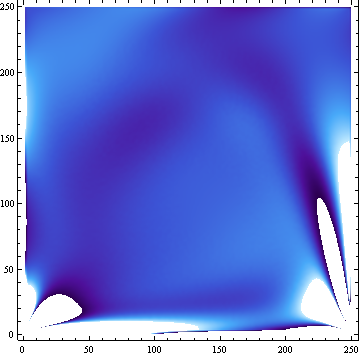
ListDensityPlot[LowpassFilter[curl, 1], ColorFunction -> "DeepSeaColors"]

enter image description here


OK, I forgot about ListLineIntegralConvolutionPlot:

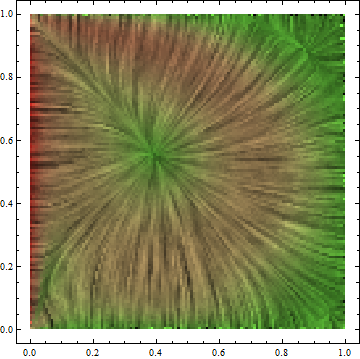
ListLineIntegralConvolutionPlot[Transpose[{u, v}, {3, 1, 2}], 
 ColorFunction -> "RoseColors", DataRange -> {{0, 1}, {0, 1}}]
(* The following piece of code produces the same graph. *)
(*
{fu, fv} = ListInterpolation[#, {{0, 1}, {0, 1}}] & /@ {u, v}
LineIntegralConvolutionPlot[{fu[x, y], fv[x, y]}, {x, 0, 1}, {y, 0, 1}, 
 ColorFunction -> "RoseColors"]
*)

enter image description here

$\endgroup$
4
  • $\begingroup$ Hi, is it possible to use LineIntegralConvolutionplot. The u and v are discrete values and using the function Interpolation, the discrete solution can be converted into a black-box continuous function. Something like : blog.wolfram.com/2013/07/09/… I will be trying to use this method and will post the code if I am able to run it. $\endgroup$
    – user11948
    Commented Aug 20, 2015 at 16:10
  • 1
    $\begingroup$ @user11948 Code added, have a look. $\endgroup$
    – xzczd
    Commented Aug 21, 2015 at 3:24
  • $\begingroup$ If I wish to evaluate stream-function using trapezoidal rule and perform integration u*dy over the complete domain, is there a mathematica inbuilt function to evaluate it or I need to run a loop. Thanks $\endgroup$
    – user11948
    Commented Sep 9, 2015 at 1:17
  • $\begingroup$ @user11948 Simply use Mean@(Most@# + Rest@#)/2 &@u. You can also try the combination of Interpolation and NIntegrate if you're not insist on trapezoidal rule. Well… I really suggest you to set more effort on learning the basic of Mathematica. $\endgroup$
    – xzczd
    Commented Sep 15, 2015 at 10:42
3
$\begingroup$

The following part is incorrect, and redundant anyway:

\[Psi]= \[Integral]u dx= \[Integral]v dy
\[Omega]= \[PartialD]v/dx-\[PartialD]u/dy

Otherwise, the code you copied has only one major problem, in the definition of n. If you try to execute it, you get Do::iterb: Iterator {j,2,n-1} does not have appropriate bounds. >> which suggests where the problem might lie. In fact, n is defined as the output of Dimensions, so it is a list and not a number as defined. You can fix that by using:

n = First@Dimensions[u, 1];

instead of your definition.

Once you do that, all the rest works as intended:

Mathematica graphics

Mathematica graphics

$\endgroup$
3
  • $\begingroup$ Thanks for your comment. But these results are not correct. If you see the link attached, the streamline plot and vorticity plot looks totally different. One reason might be my velocity vector field is incorrect but i have cross verified it with existing literature and my velocity data is correct $\endgroup$
    – user11948
    Commented Aug 19, 2015 at 18:12
  • $\begingroup$ I am afraid that you will have to take that up with the original author of the code then. I know nothing about computational fluid dynamics. One thing I can suggest, however, is to check whether the explicit values chosen by the original author for contour levels etc are still relevant to your results. $\endgroup$
    – MarcoB
    Commented Aug 19, 2015 at 19:16
  • $\begingroup$ @MacroB : So is it possible to perform the integration on discrete values of u and v to evaluate streamlines? Is there any other way to run integration in mathematica. I can run this using Numerical methods but then I need to use finite difference and in order to check for the convergence , it will take lot of time. And most importantly I appreciate you helping you out . Thanks a lot for your time $\endgroup$
    – user11948
    Commented Aug 20, 2015 at 2:12

Your Answer

By clicking “Post Your Answer”, you agree to our terms of service and acknowledge you have read our privacy policy.

Not the answer you're looking for? Browse other questions tagged or ask your own question.