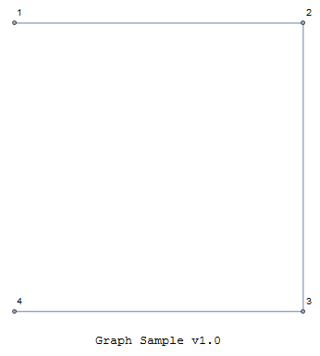
Here is a simple code I wrote to visualize what I am trying to achieve:
C.1
Labeled[Graph[Range[#], Table[i <-> i + 1, {i, Range[# - 1]}],
VertexCoordinates -> {{-5, 5}, {5, 5}, {5, -5}, {-5, -5}},
VertexLabels -> "Name"], "Graph Sample v1.0"] &@4

In this code snipet, the vertices and edges are generated semi-automatically for the users convienience. The number &@4, ideally should be replaced by the length of a list containing a set of coordinates defined by the user.
I believe I can achieve this using Length[expr] function which could be fed the user defined set of cooordinates as an input.
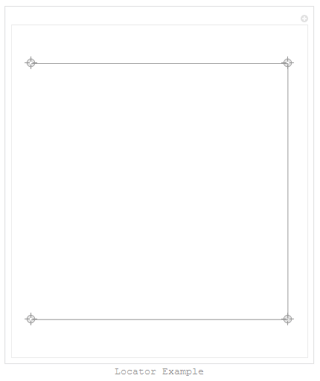
In order to achieve what I have described above, I have employed a variation of code such as:
C.2
Labeled[Manipulate[Graphics[{Line[v]},
PlotRange -> {-6, 6}], {{v, {{-5, 5}, {5, 5}, {5, -5}, {-5, -5}}},
Locator, LocatorAutoCreate -> True}], "Locator Example"]

NOTE
N.1 - I am aware that the code does contain an equal set of coordinates as in my first code snipet above.
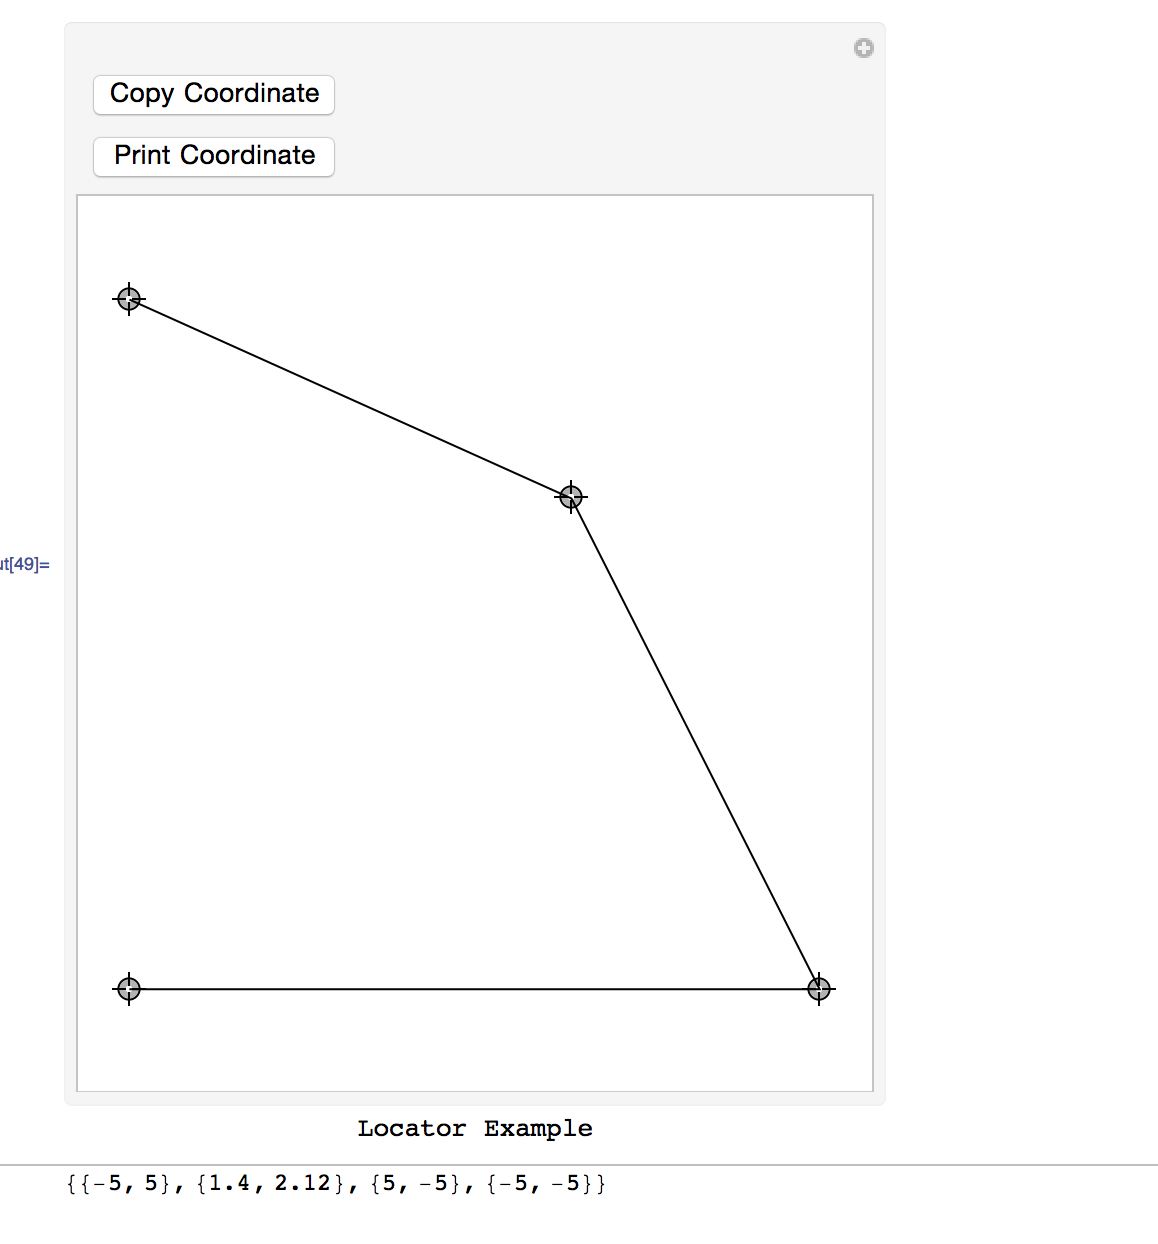
However, I was unable to extract the generated list of coordinates which could be used to define VertexCoordinates in a Graph. Additionally inheriting a new problem with the locator requiring an input in a form of coordinates for initialisation..
As the title says, I would appreciate if anyone could give me some pointers or assistance with this problem. I am also considering extending this into three-dimensions and would appreciate any input on that on seperate basis. Many thanks in advance. Hope the question is well rounded and provides enough ground to go by.
-e


